Introducing Custom Columns in PayHelm
Our custom columns feature offers users a dynamic toolset for crafting unique metrics and incorporating custom calculations into your data analytics. Imagine you're using our app to analyze your data. With the custom columns feature, you're not limited to pre-defined metrics or calculations. Instead, you have the freedom to design and implement your own, giving you unparalleled control over how you interpret and utilize your data.
Whether you're tracking sales performance, monitoring website traffic, or analyzing customer feedback, this feature puts the power in your hands to create metrics that reflect the exact insights you're seeking. Plus, it's incredibly intuitive to use, allowing you to seamlessly add, edit, and manage your custom columns.
By incorporating custom columns into your data analysis workflow, you're not just crunching numbers – you're crafting a tailored approach that aligns perfectly with your unique business objectives or personal interests. So, dive in, explore, and unleash the full potential of your data analysis with our custom columns feature.
How to Create Custom Columns in PayHelm
Creating custom columns is a breeze! Just follow these simple steps:
- Go to the "Reports" section in PayHelm.
- Look for the "Create New Report" option.
- Choose "Custom – Order Based" as your report type.
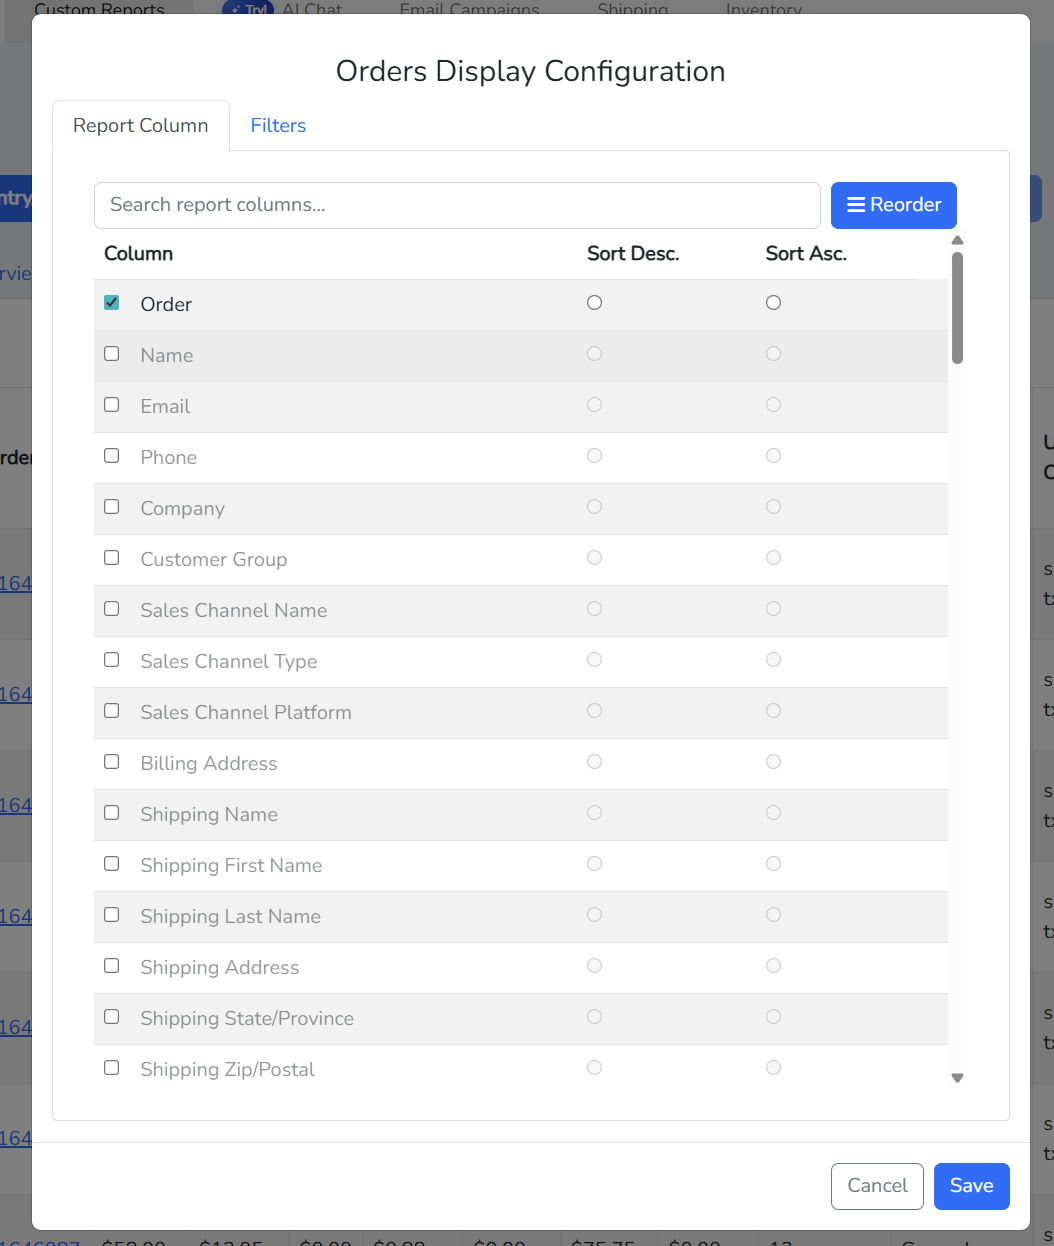
- Voila! You'll find the custom column tab right there, ready for you to craft your unique metrics and calculations.
Once you've done that, here's a few steps to follow to properly configure your custom column definitions:
Define: Conditional (Optional)
If you want to include a condition for your custom calculation, you can specify it using the following format:
[Key] [Comparison Operator] [Value]
or
([Key] [Comparison Operator] [Value]) and ([Key] [Comparison Operator] [Value]) – For Grouping format
Example 1: total_sales > 1000
Example 2: (customer_company == "Google") and (total_sales > 1000)
Note: When utilizing text or characters as values, it is necessary to enclose them within double quotation marks.
Available keys for conditions:
customer_id, name, customer_email, customer_phone, customer_company, customer_group_name, tax_exempt_category, customer_form_fields, shipping_form_fields, billing_full_address, shipping_full_address, billing_street_address, shipping_street_address, shipping_city, shipping_province, shipping_zip, last_order_date, total_tax, tax_rate, gross_tax_rate, total_costs, gross_margin, merchant_id, grand_total, total_shippings, total_cost_of_refunds, total_store_fees, avg_shipping, total_discounted_orders, total_store_credit_refund, total_shipping_refund, total_refund_tax, net_sales, avg_items_per_order, avg_price, total_items_sold, total_orders, total_sales, total_refunds, total_items_refunded, avg_fulfillment_time, min_fulfillment_time, max_fulfillment_time, total_profit, avg_tax, avg_order, max_sales, min_sales, max_tax, min_tax, max_shipping, min_shipping, max_discount, min_discount, skus
Available comparison operators:
< (less than)<= (less than or equal to)> (greater than)>= (greater than or equal to)== (equal to)!= (not equal to)( and ) (parentheses for grouping expressions)
Define: Calculation (Required)
After specifying the condition (if applicable), proceed to define the calculation expression. Use the following format:
[Key] [Operator] [Value]
([Key] [Comparison Operator] [Value]) and ([Key] [Comparison Operator] [Value]) – For Grouping format
Example 1: total_sales + total_tax
Example 2: total_sales + 20000
Available keys for calculations:
total_tax, tax_rate, gross_tax_rate, total_costs, gross_margin, grand_total, total_shippings, total_cost_of_refunds, total_store_fees, avg_shipping, total_discounted_orders, total_store_credit_refund, total_shipping_refund, total_refund_tax, net_sales, avg_items_per_order, avg_price, total_items_sold, total_orders, total_sales, total_refunds, total_items_refunded, total_profit, avg_tax, avg_order, max_sales, min_sales, max_tax, min_tax, max_shipping, min_shipping, max_discount, min_discount
Available expression operators:
+ (addition)- (subtraction)* (multiplication)/ (division)% (modulo)^ (exponentiation)( and ) (parentheses for grouping expressions)
Available metrics:
Total Tax, Tax Rate, Gross Tax Rate, Total Costs, Gross Margin, Grand Total, Total Shippings, Total Cost of Refunds, Total Store Fees, Average Shipping, Total Discounted Orders, Total Store Credit Refund, Total Shipping Refund, Total Refund Tax, Net Sales, Average Items Per Order, Average Price, Total Items Sold, Total Orders, Total Sales, Total Refunds, Total Items Refunded, Total Profit, Average Tax, Average Order, Maximum Sales, Minimum Sales, Maximum Tax, Minimum Tax, Maximum Shipping, Minimum Shipping, Maximum Discount, Minimum Discount
Practical Examples: Building Custom Columns
Here are real-world examples showing how businesses use custom columns to track complex metrics:
Example 1: Tiered Commission Tracking
Many businesses need to calculate commissions based on sales performance thresholds. Here's how to create a "Total Commission" custom column with tiered calculations:
Field Name: Total Commission
Conditional Calculations:
- Tier 1 (3% commission):
- Condition:
(shipping_form_fields == "Sales Rep A") and (total_sales > 100000)
- Calculation:
(total_sales - 100000) * 0.03
- Tier 2 (5% commission):
- Condition:
(shipping_form_fields == "Sales Rep B") and (total_sales > 100000)
- Calculation:
(total_sales - 100000) * 0.05
- Enterprise Tier (2% on high-value accounts):
- Condition:
(shipping_form_fields == "Account Manager") and (account.total_sales > 500000)
- Calculation:
(account.total_sales - 500000) * 0.02
This setup calculates commissions only on sales exceeding the threshold amount, with different rates for different team members or roles.
Example 2: Regional Performance Metrics
Track performance across different regions with conditional calculations:
Field Name: Regional Sales Performance
Conditional Calculations:
- Condition:
(shipping_province == "CA") and (total_sales > 50000)
- Calculation:
total_sales * 1.1
This example applies a 10% bonus to California sales exceeding $50,000, useful for incentive programs or performance tracking.
Example 3: Customer Segment Analysis
Calculate net revenue for specific customer groups:
Field Name: Premium Customer Revenue
Conditional Calculations:
- Condition:
(customer_group_name == "Premium") and (total_orders > 10)
- Calculation:
total_sales - total_costs - total_discounted_orders
This helps identify actual profit from your most valuable customer segment.
Example 4: Profit Margin Calculation
Create a simple profit margin percentage column without conditions:
Field Name: Profit Margin %
Calculation: (total_profit / total_sales) * 100
This straightforward calculation gives you instant visibility into your profit margins across all orders.
Learn why PayHelm is the best ecommerce analytics tool
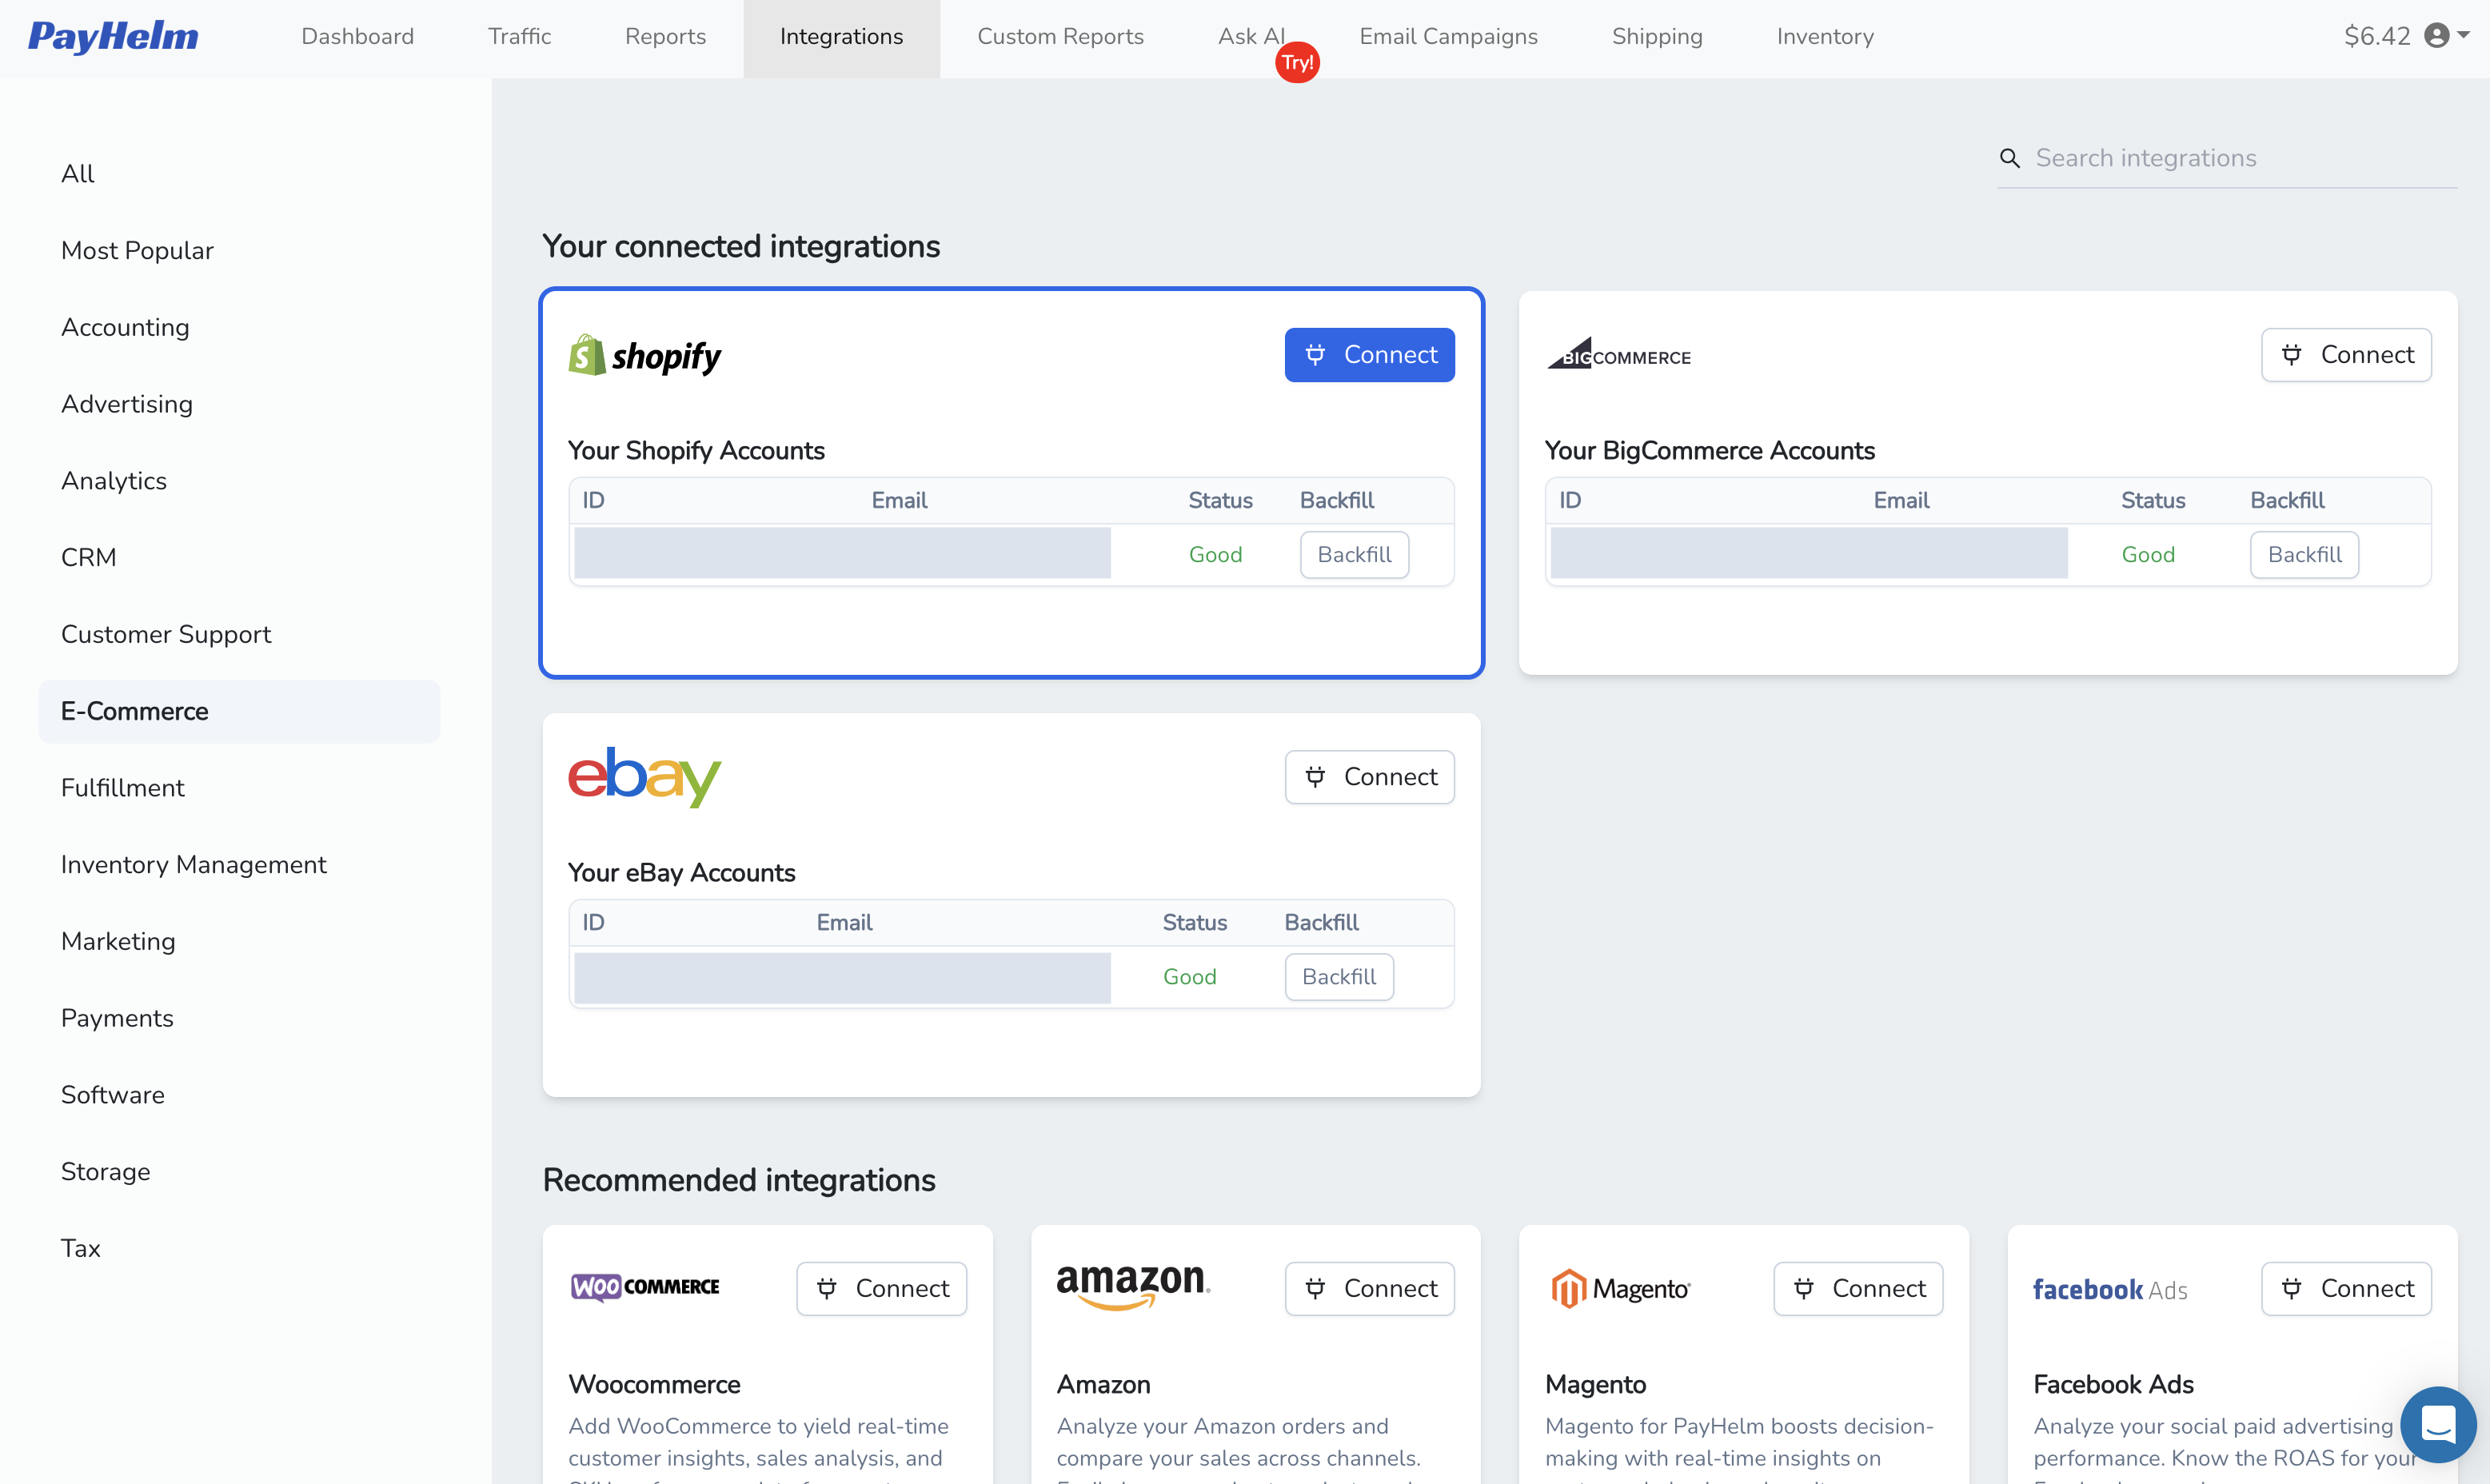
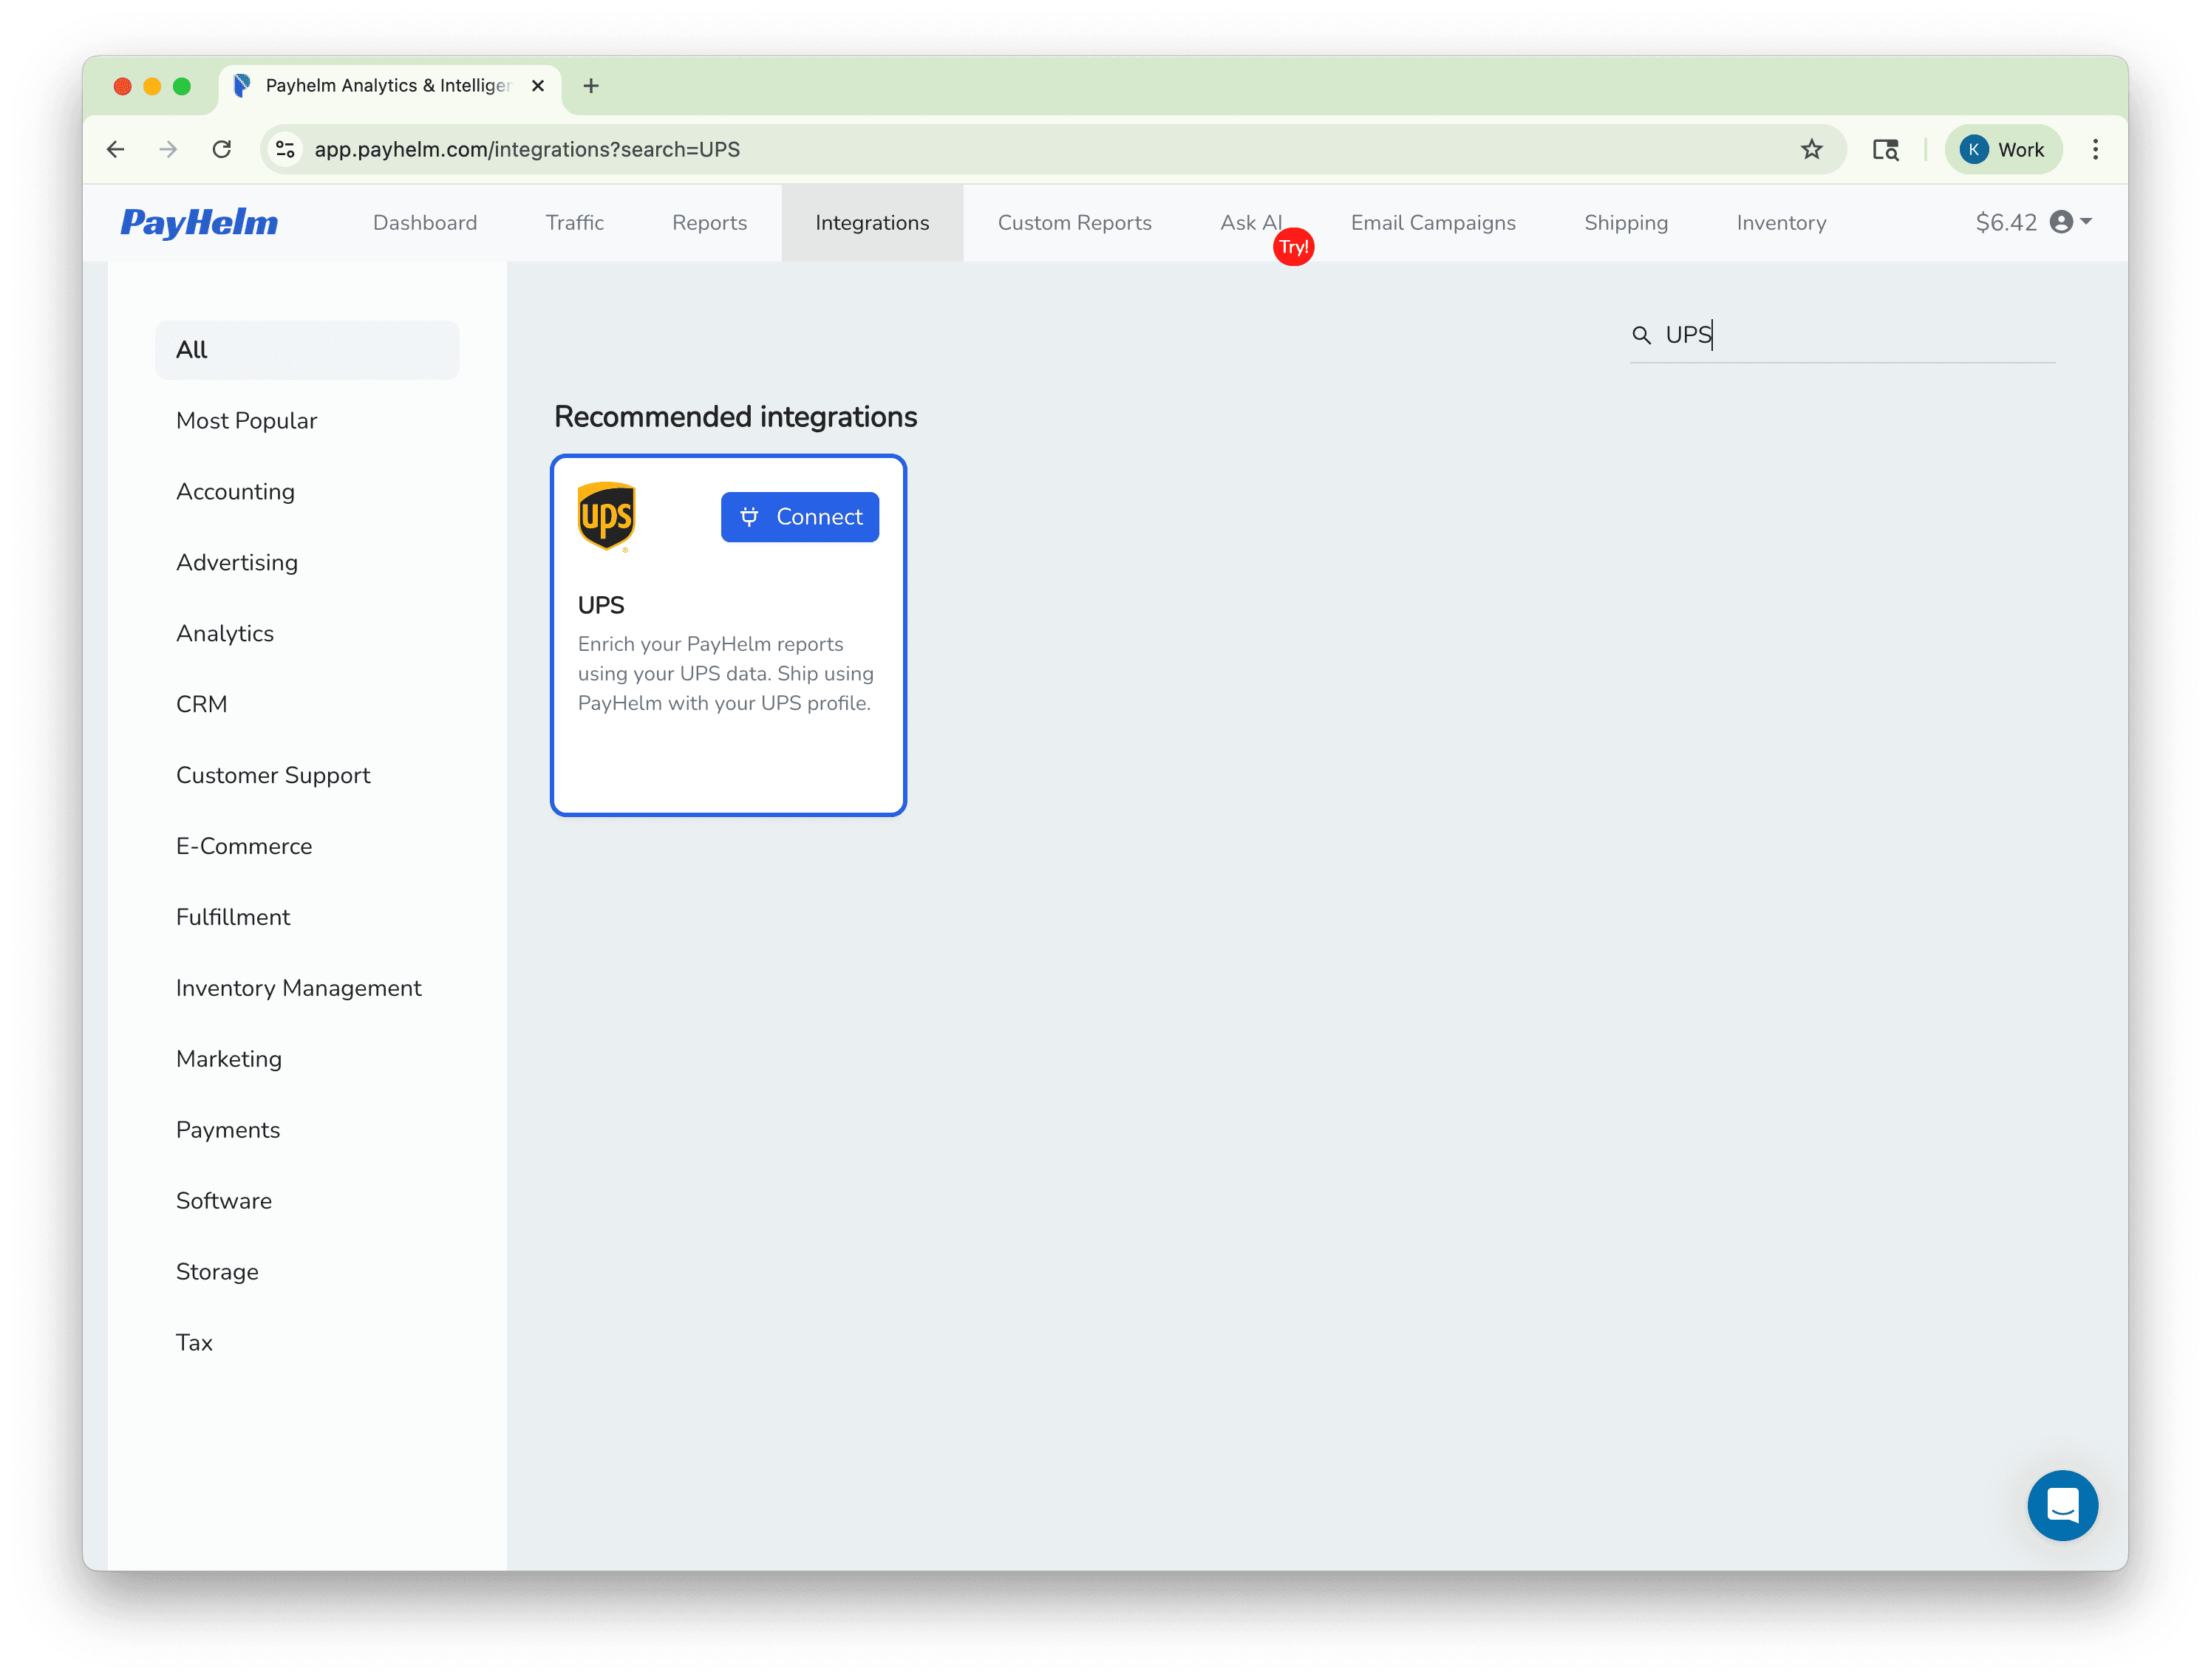
Comprehensive integration: Connect with Google Analytics, Shopify, and 180+ other applications
Full customer journey tracking: Attribute sales across multiple marketing channels
Customizable dashboards: Create personalized views of your business performance (PayHelm Pro)
Custom reporting: Extended functionality across all integrations (PayHelm Plus)
Ready to transform your ecommerce analytics? Book a demo to see how PayHelm can help you gather relevant data, make informed decisions, and increase profitability.