Powerful features
for modern commerce
Everything you need to understand your customers, optimize your marketing, and grow your business.
Unified Data Engine
Connect all your data sources into one powerful platform. No more data silos, no more manual exports.
- 50+ native integrations
- Real-time data sync
- Automated data cleaning
- Custom API endpoints
AI-Powered Attribution & LTV
Understand the true impact of every touchpoint with machine learning attribution models.
- Multi-touch attribution
- Predictive LTV analysis
- Customer journey mapping
- Smart recommendations
Custom Metrics & Pivots
Build exactly the metrics your business needs. Pivot data any way that makes sense.
- Drag-and-drop metric builder
- Advanced segmentation
- Custom cohort analysis
- Automated reporting
Conversion Routing
Optimize your funnel with intelligent conversion tracking and routing.
- Funnel analysis
- A/B test tracking
- Conversion optimization
- Goal tracking
Exports to Sheets, OpenAI, Pixels
Connect your insights to the tools you already use. Export anywhere, anytime.
- Google Sheets integration
- OpenAI API connection
- Pixel tracking
- Webhook automation
Enterprise Security
Bank-grade security built on SOC 2 best practices and enterprise-level data protection.
- SOC 2 Secure
- GDPR-ready
- Data encryption
- Access controls
See it in action
Interactive previews of PayHelm's most powerful features.
Multi-source Data Unification
Watch as data from Amazon, Shopify, Google Ads, and more flows into a single, unified dashboard in real-time.
Customer Journey Visualization
See exactly how customers discover, engage, and convert across all your touchpoints.
AI-Powered Insights
Get intelligent recommendations to optimize your marketing spend and increase ROI.
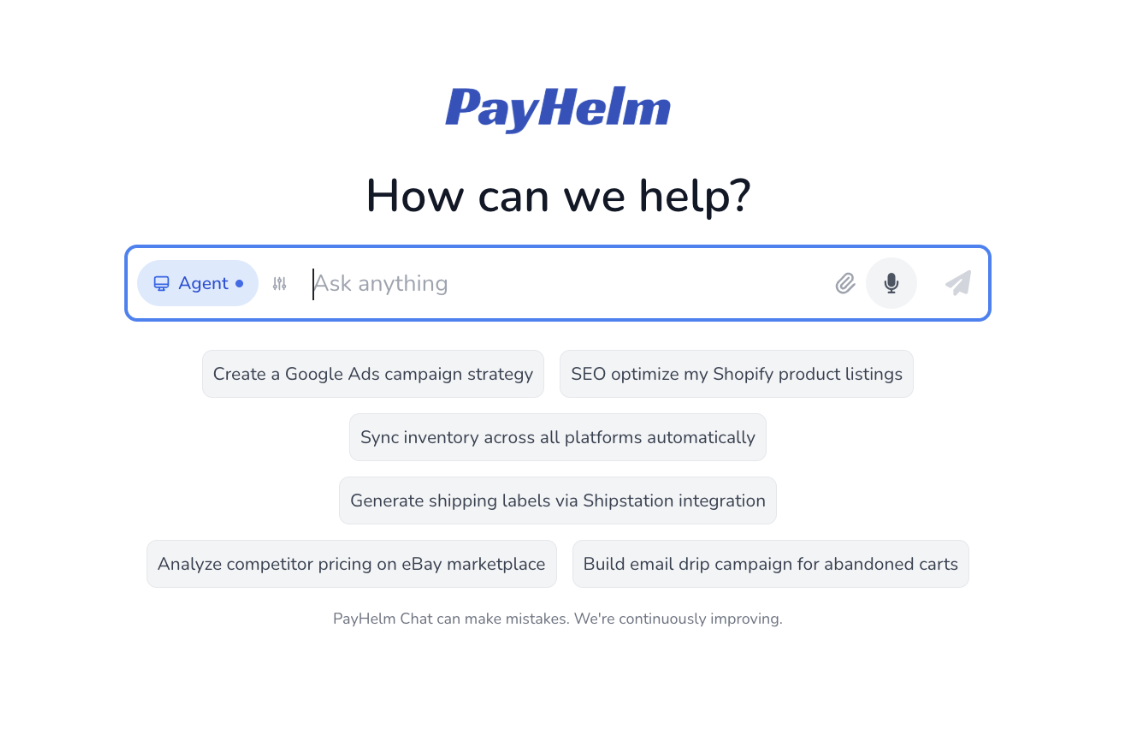
Meet your AI analytics agent
Ask questions in plain English, generate reports on the fly, and let the AI agent handle complex analysis automatically.
Conversational Analytics
Ask any business question and get instant, accurate answers with charts and data.
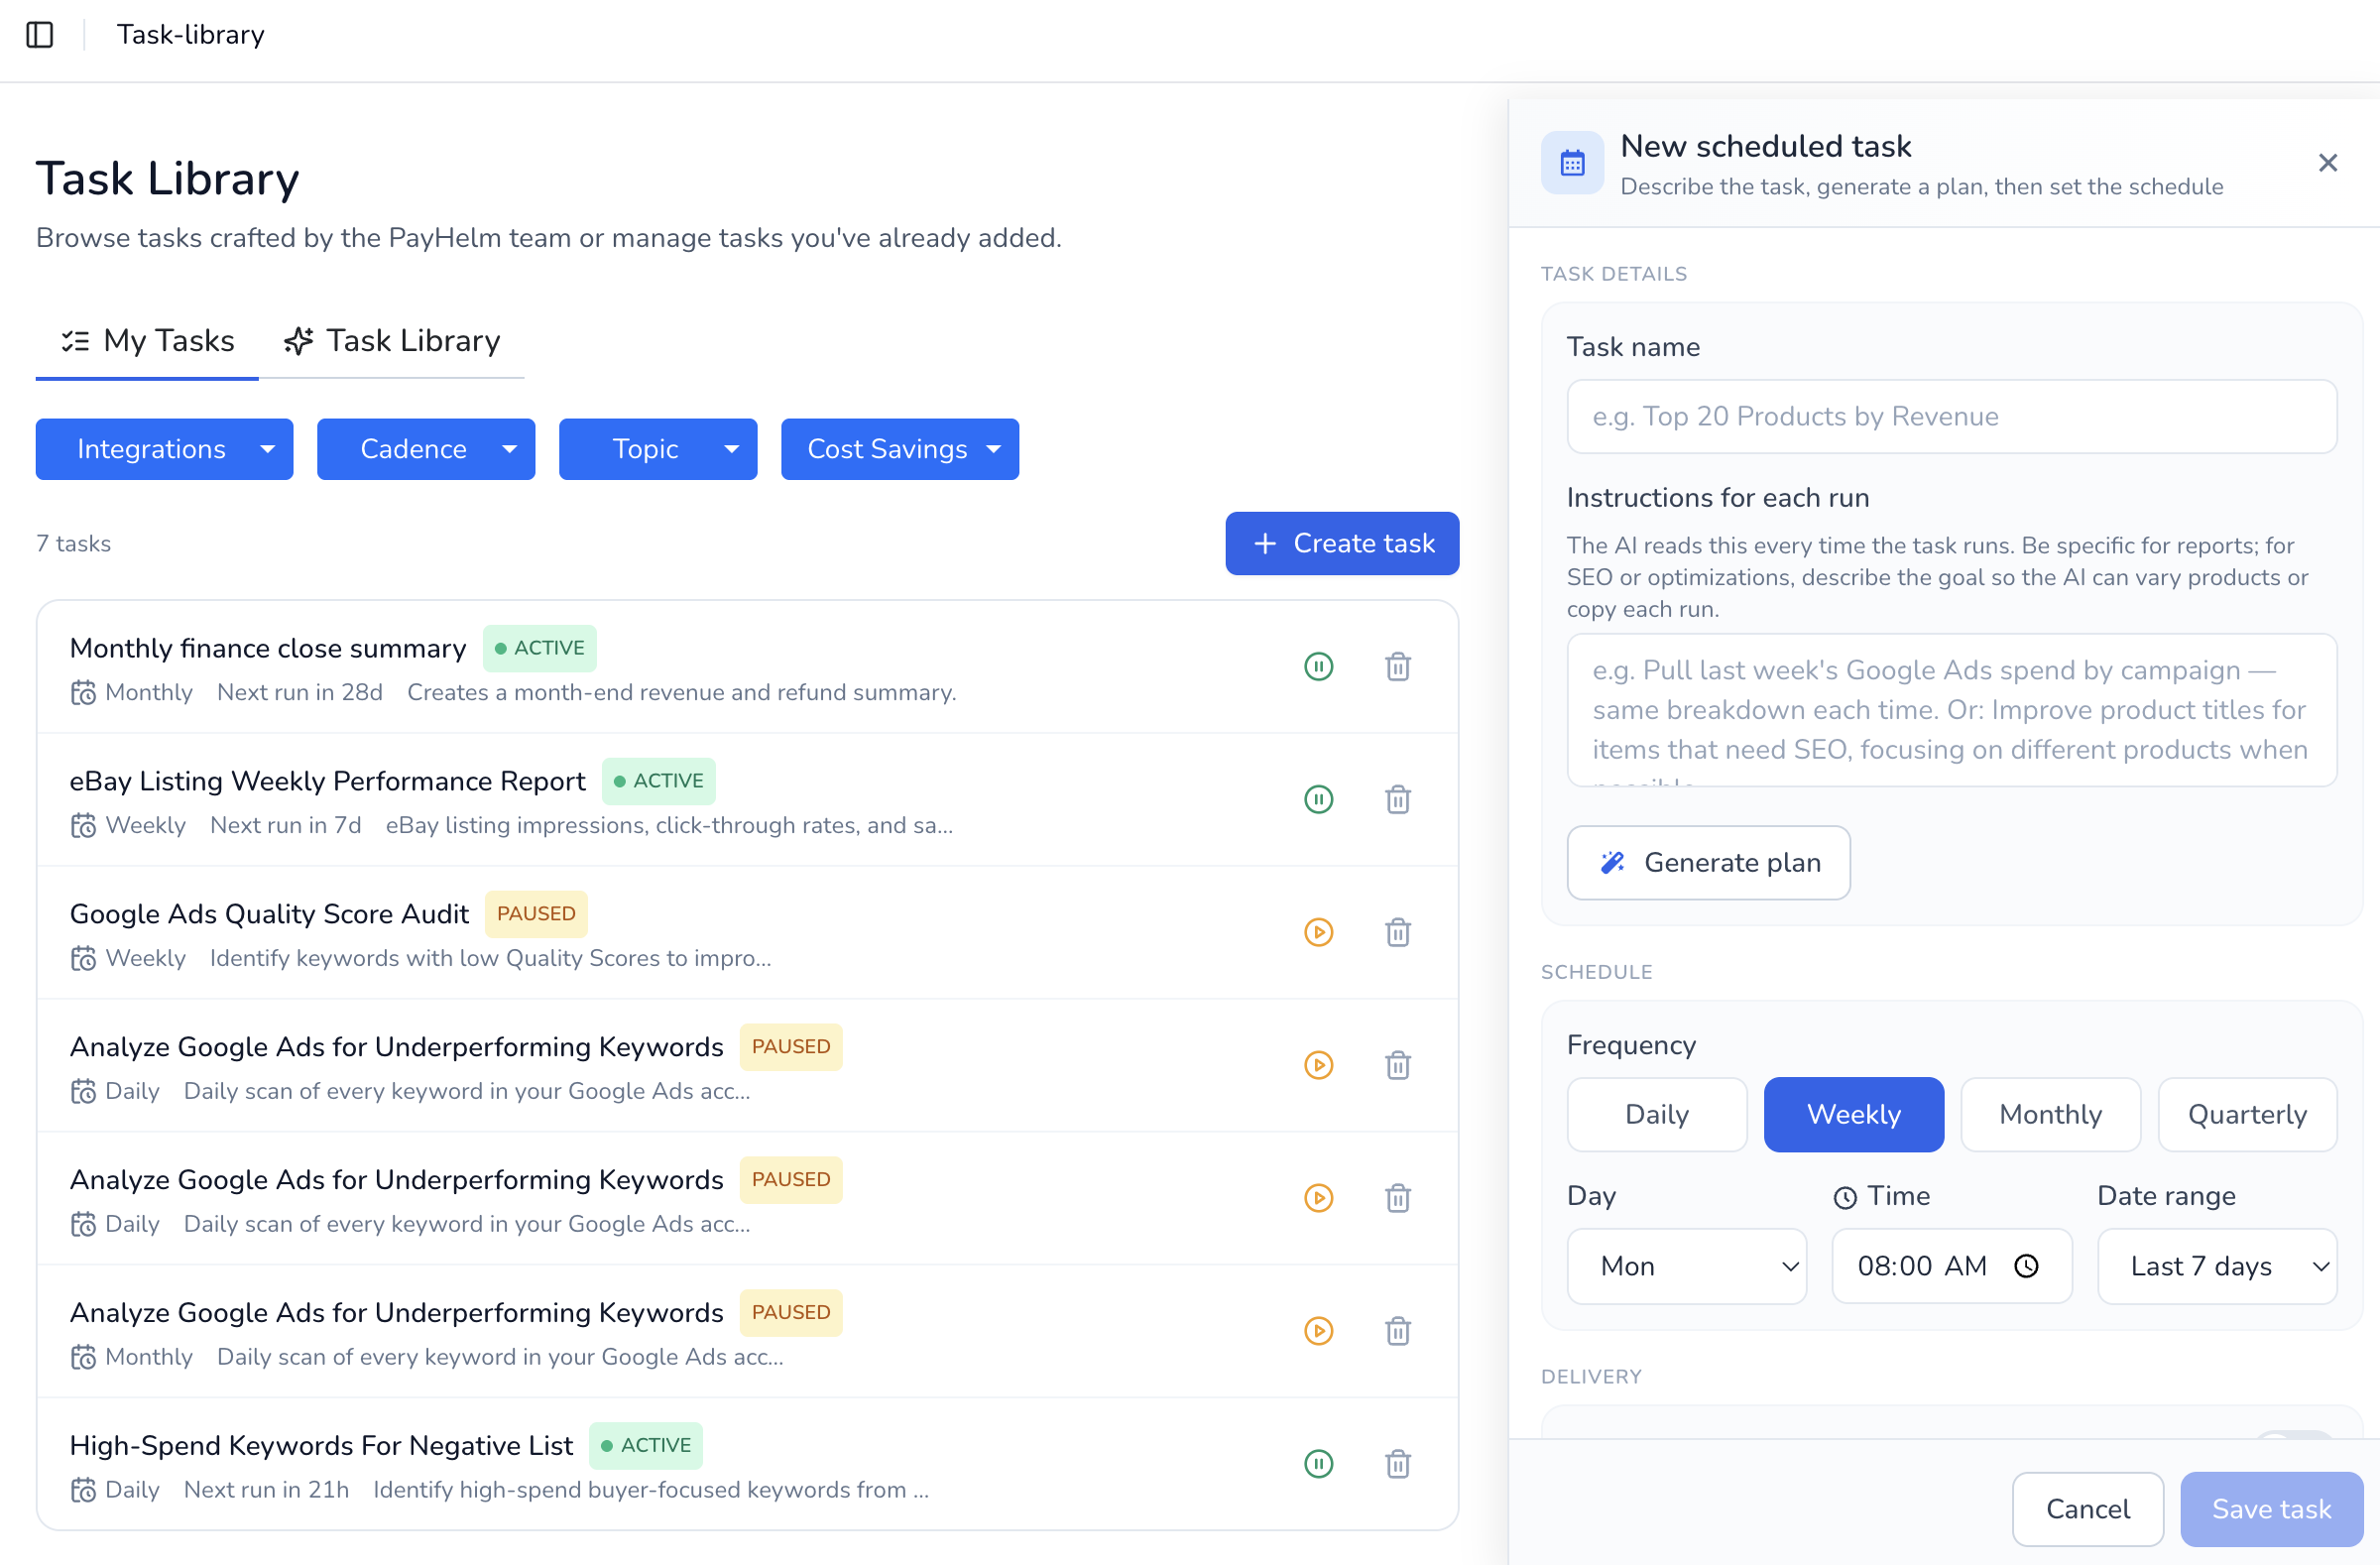
Agentic Task Automation
Set up intelligent agents that monitor your data and take action automatically.
Powerful dashboards in action
Real PayHelm dashboards showing comprehensive analytics across all your business functions.
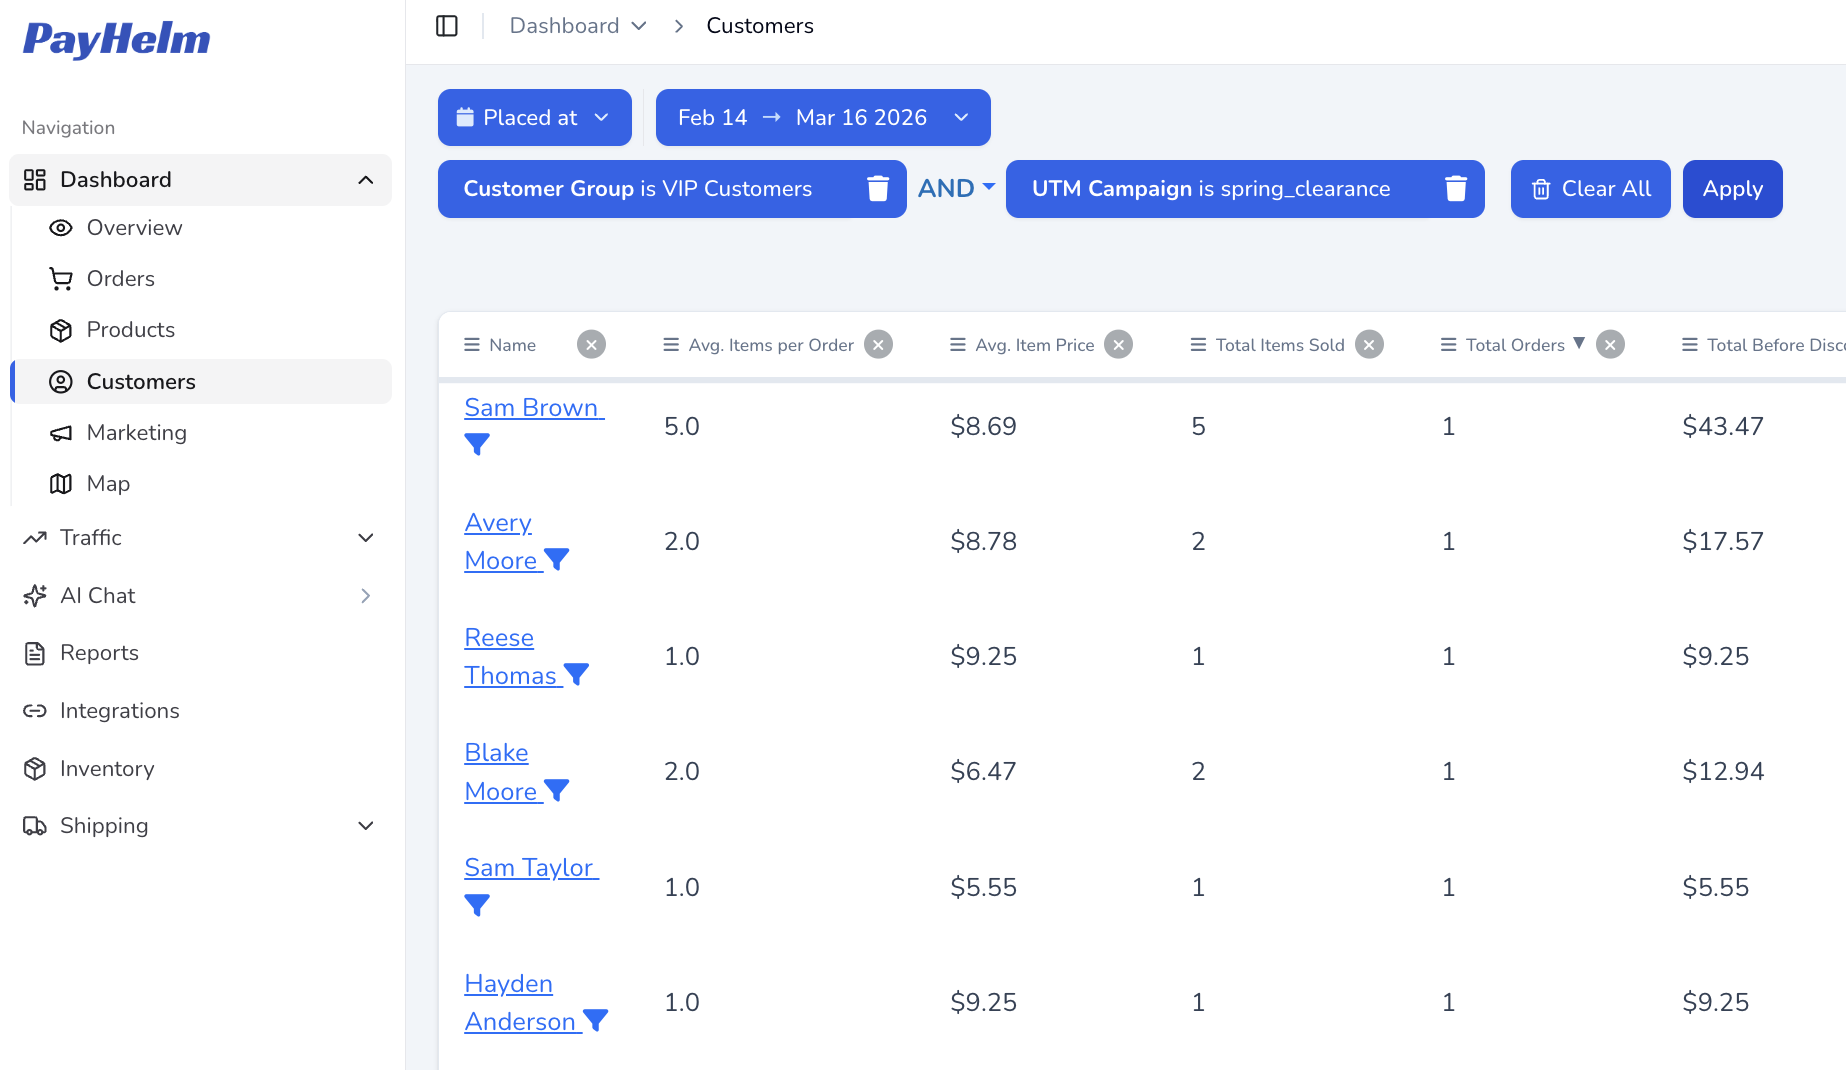
Advanced Filtering & Segmentation
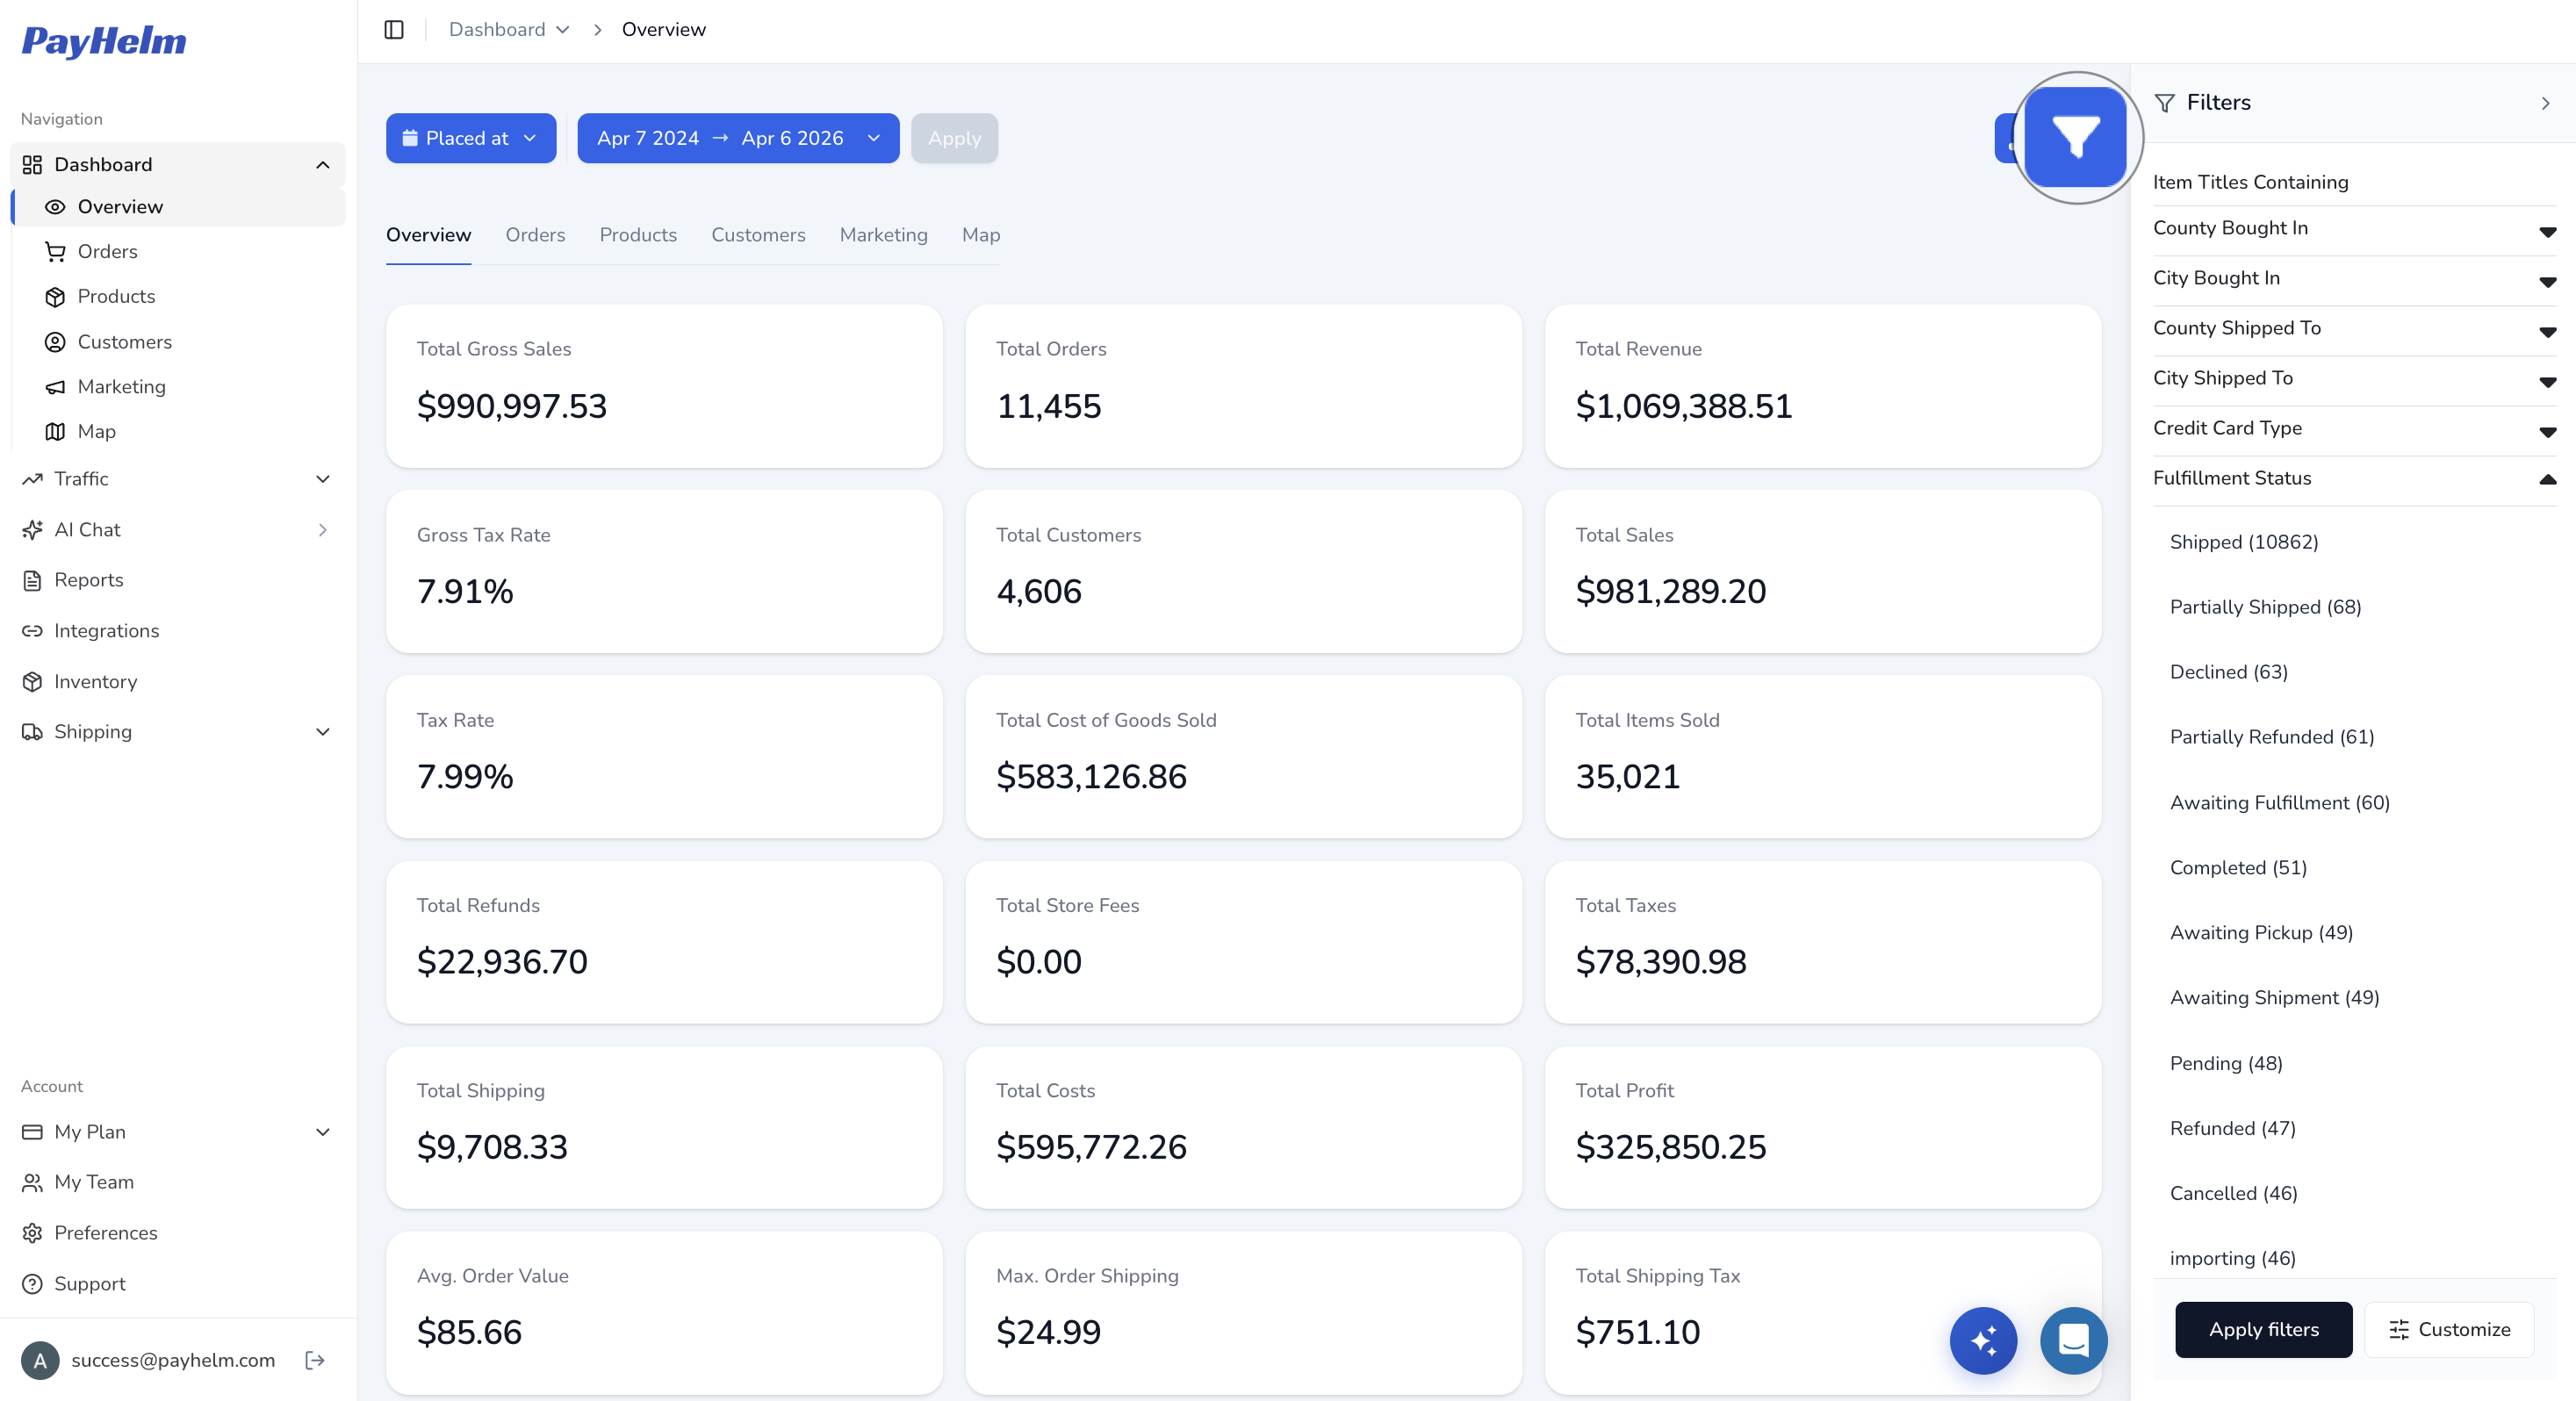
Geographic Performance Analysis
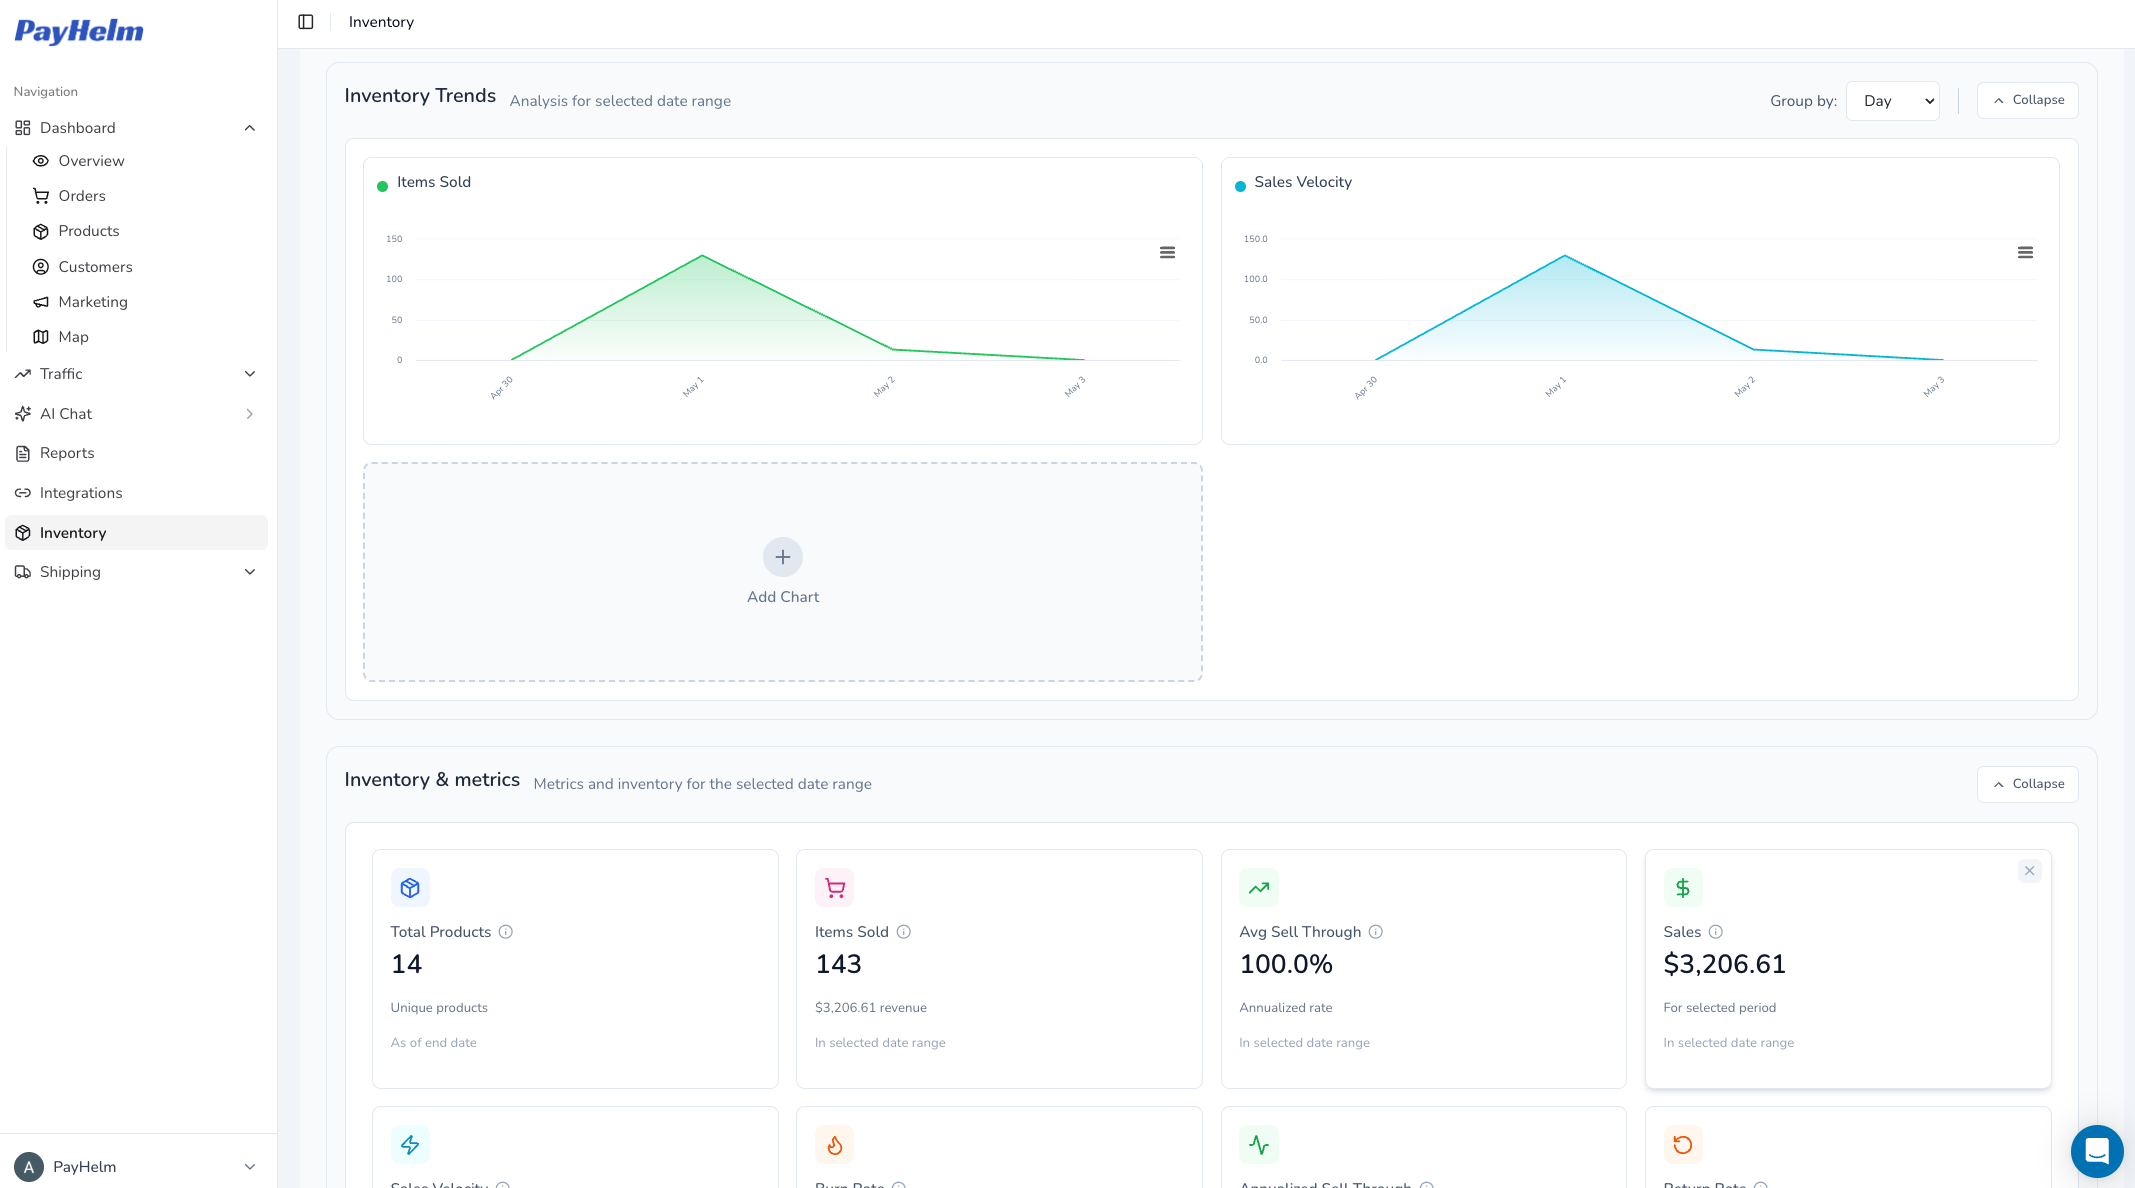
Inventory Management & Tracking
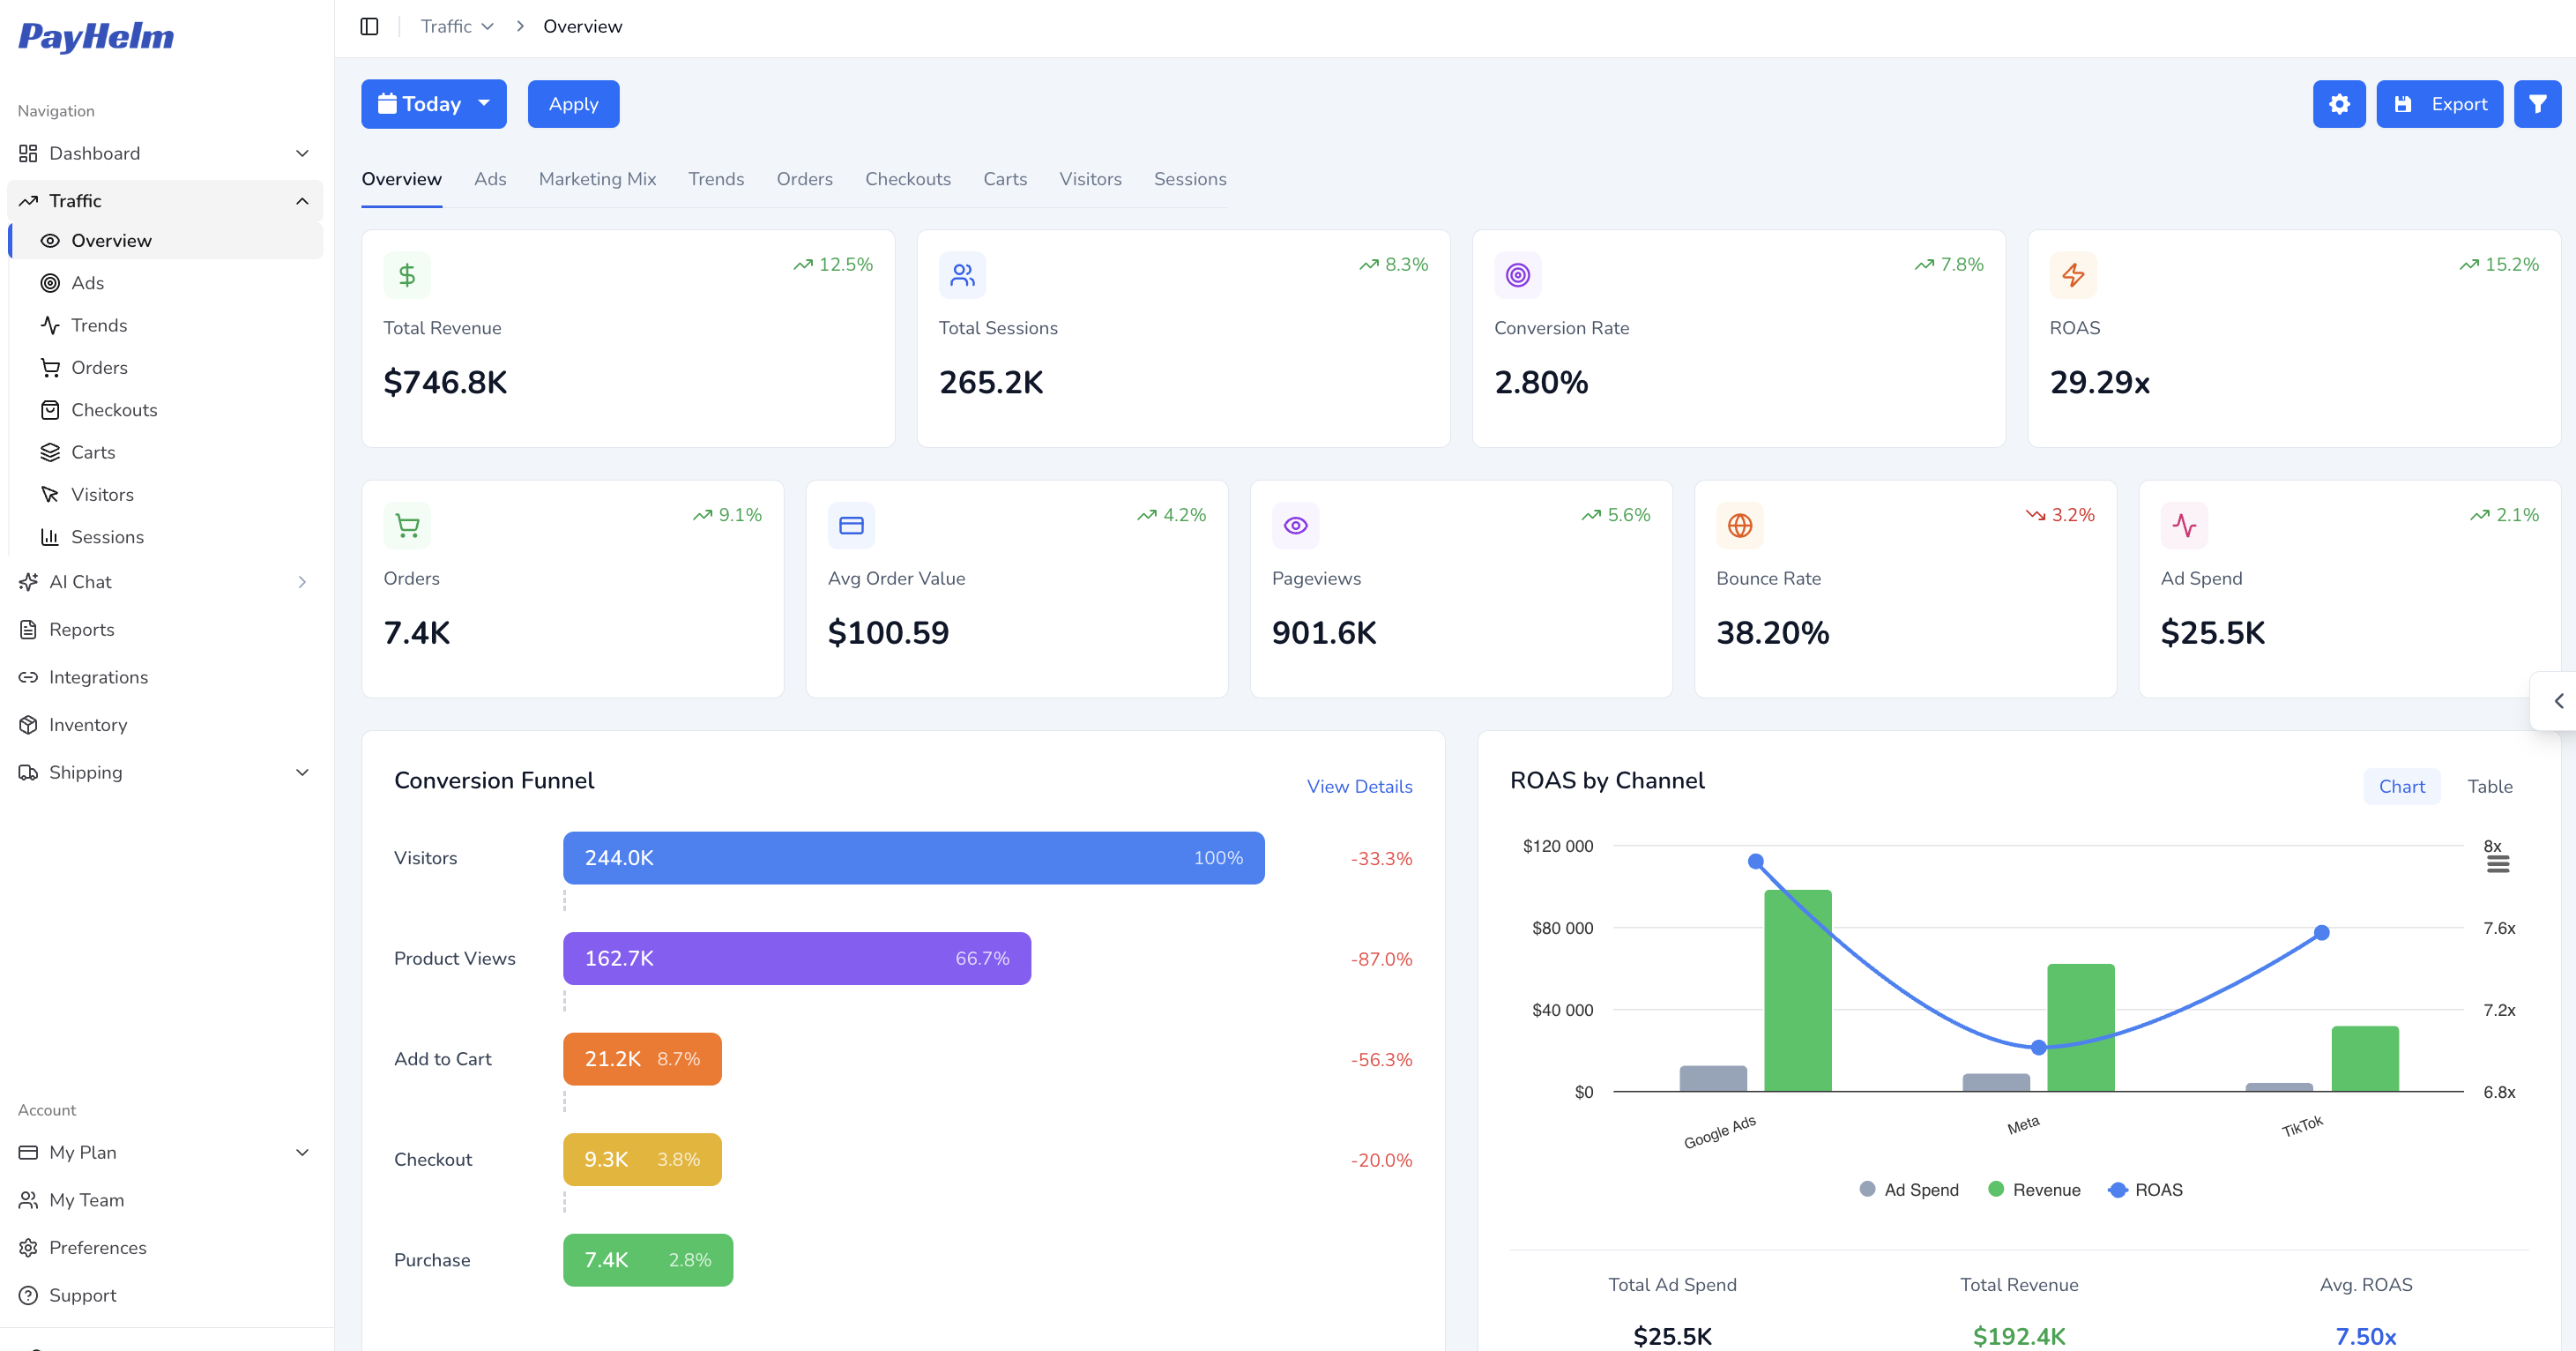
Traffic & Campaign Analytics
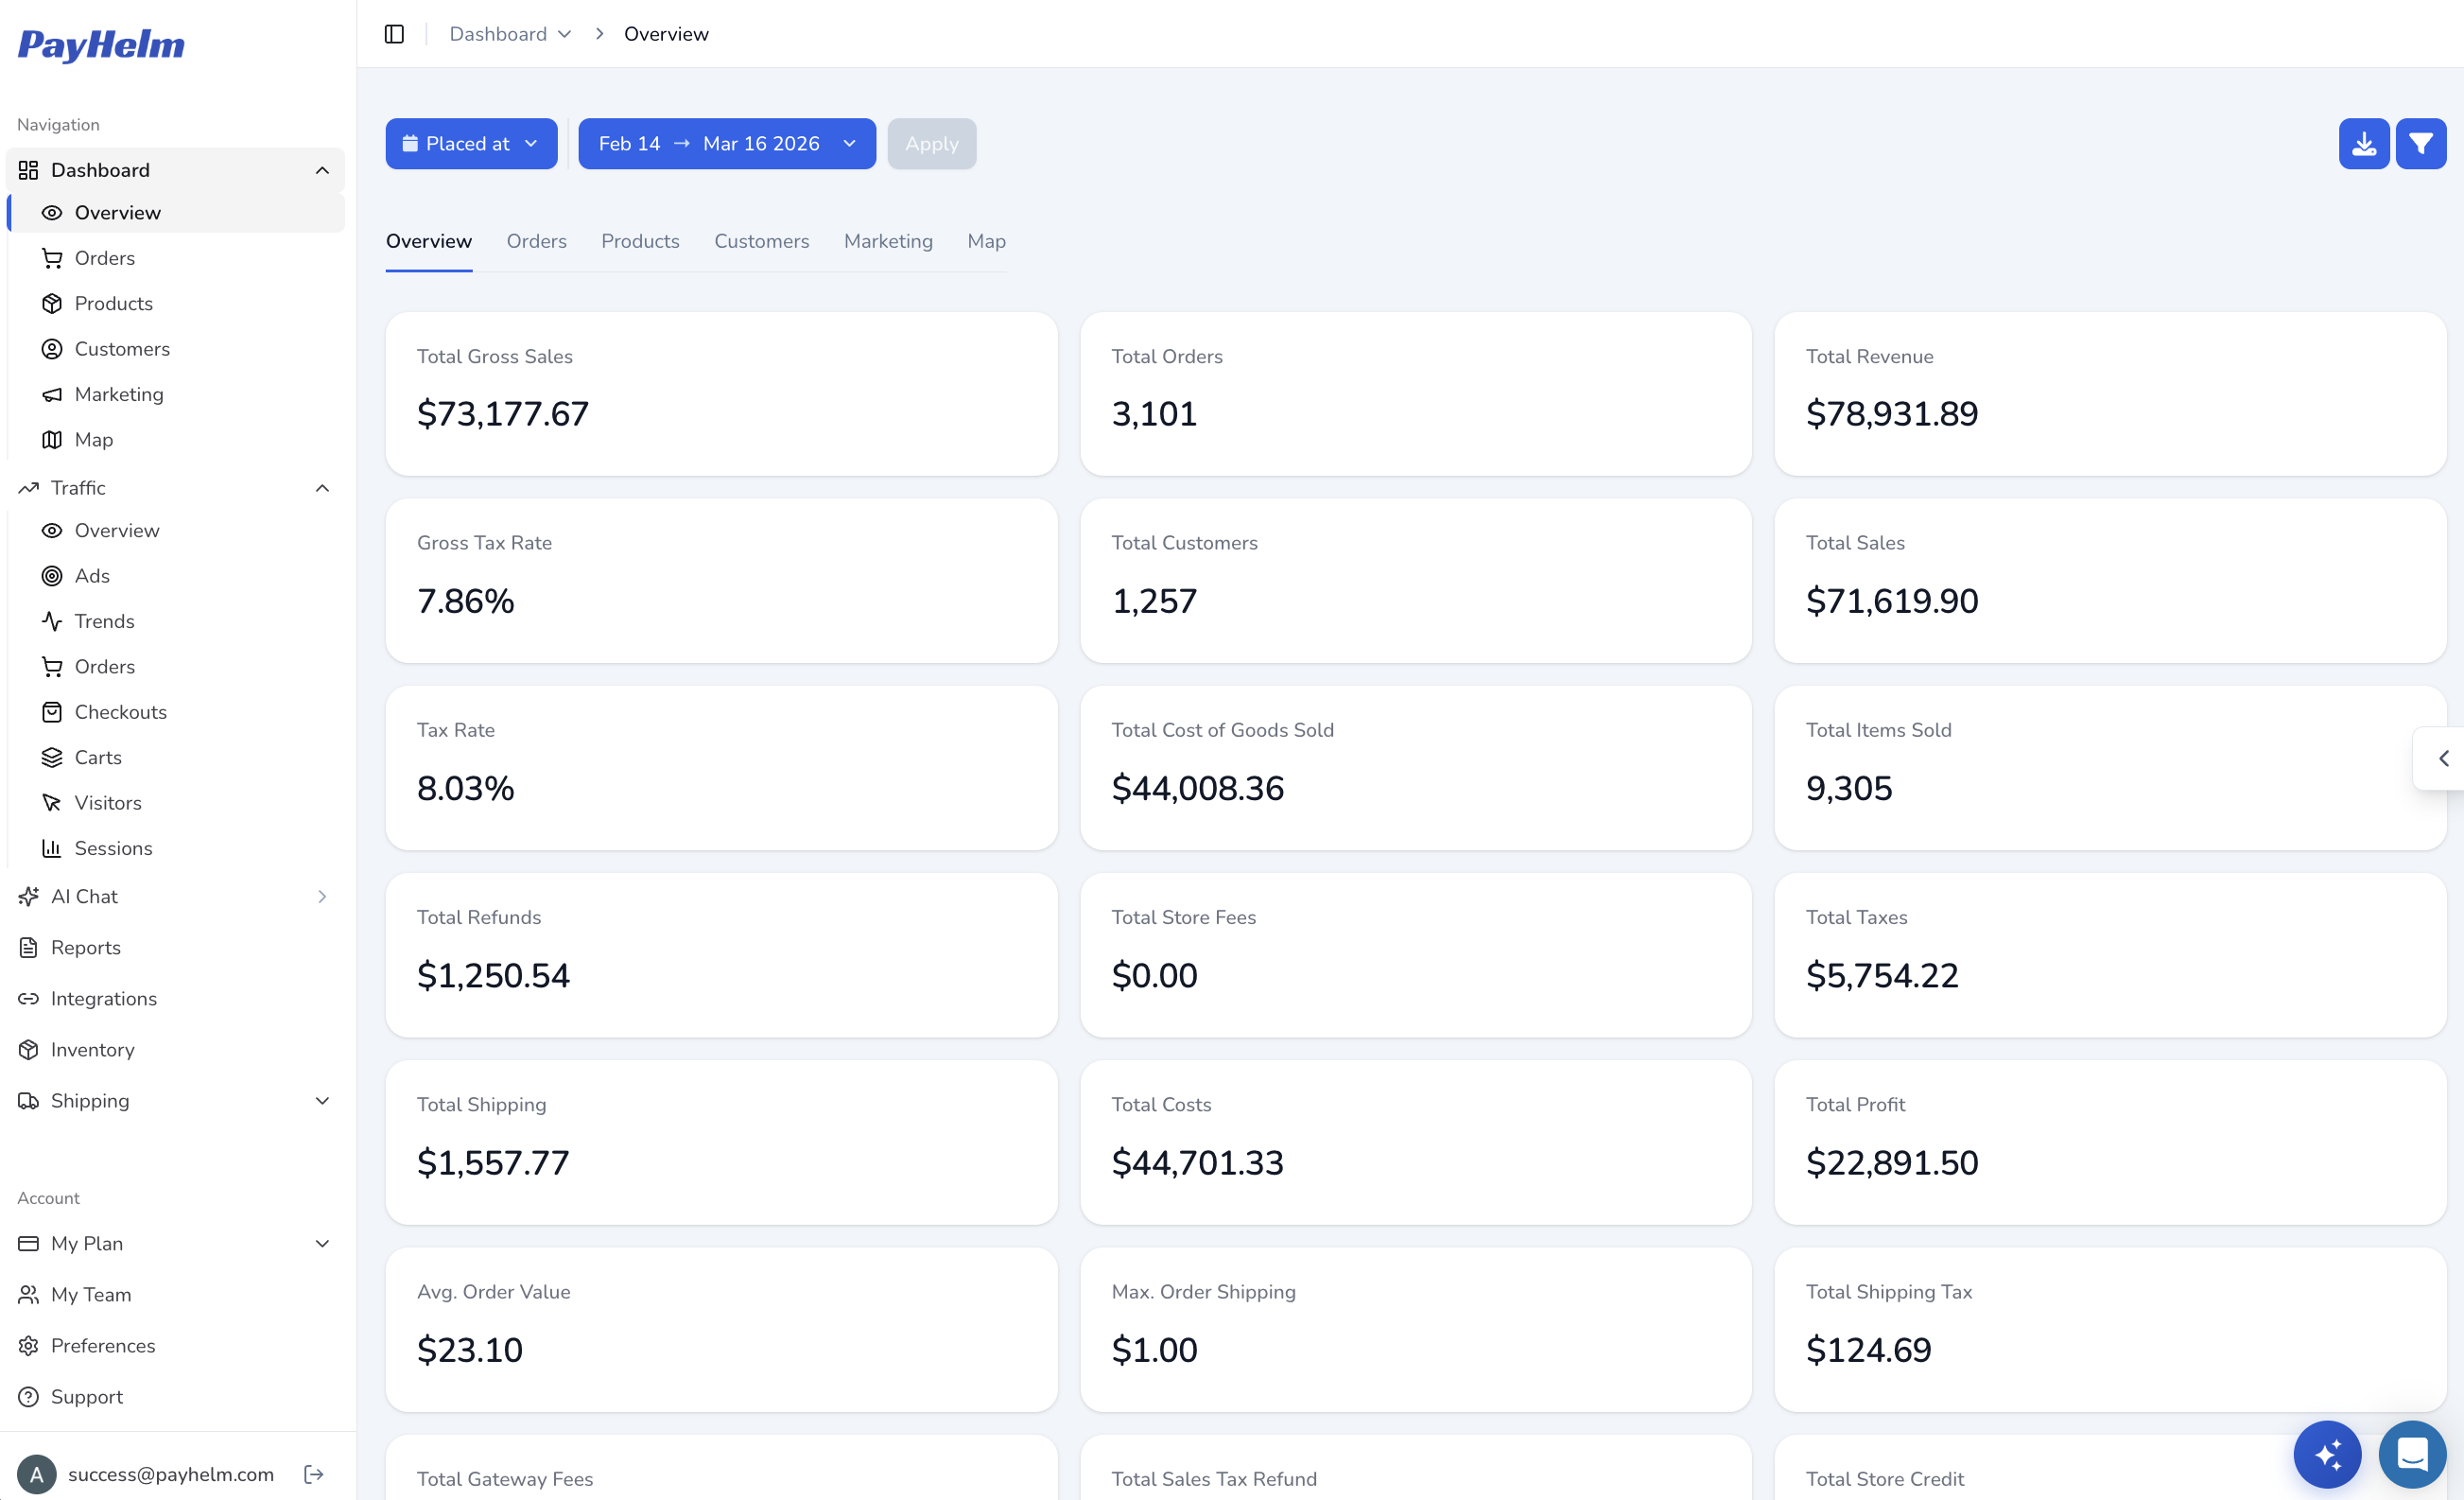
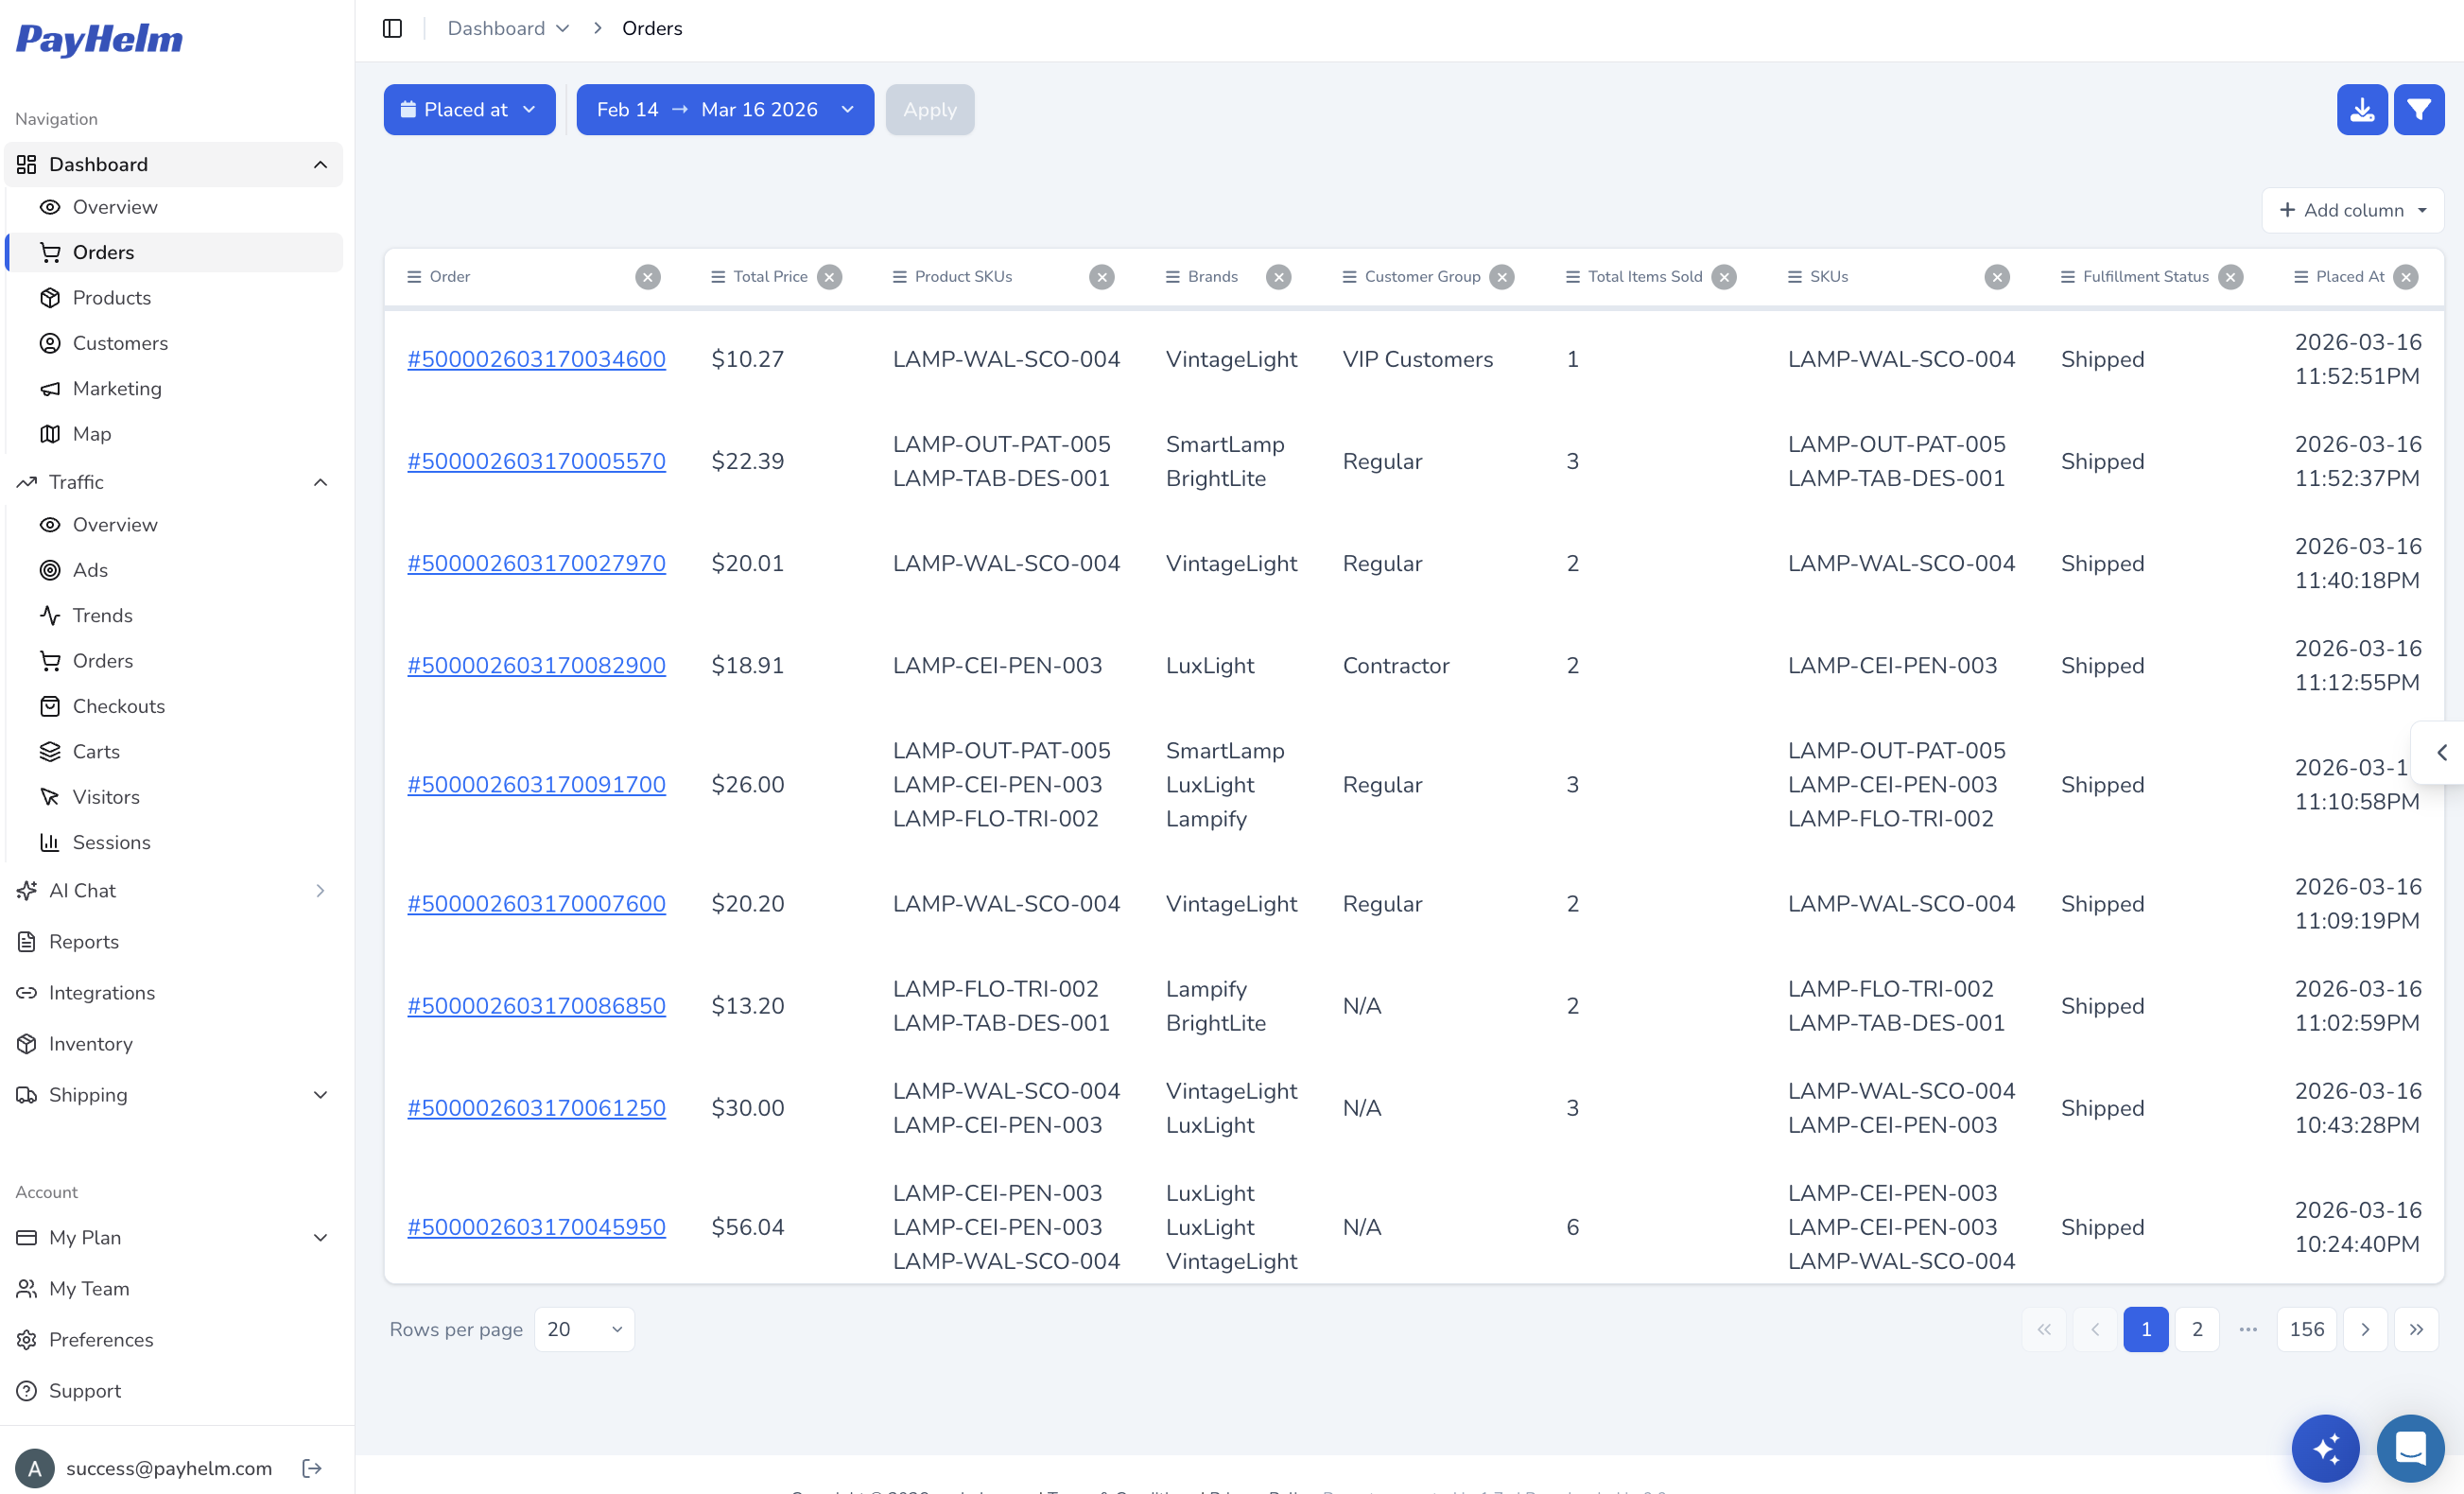
Orders & Revenue Dashboard
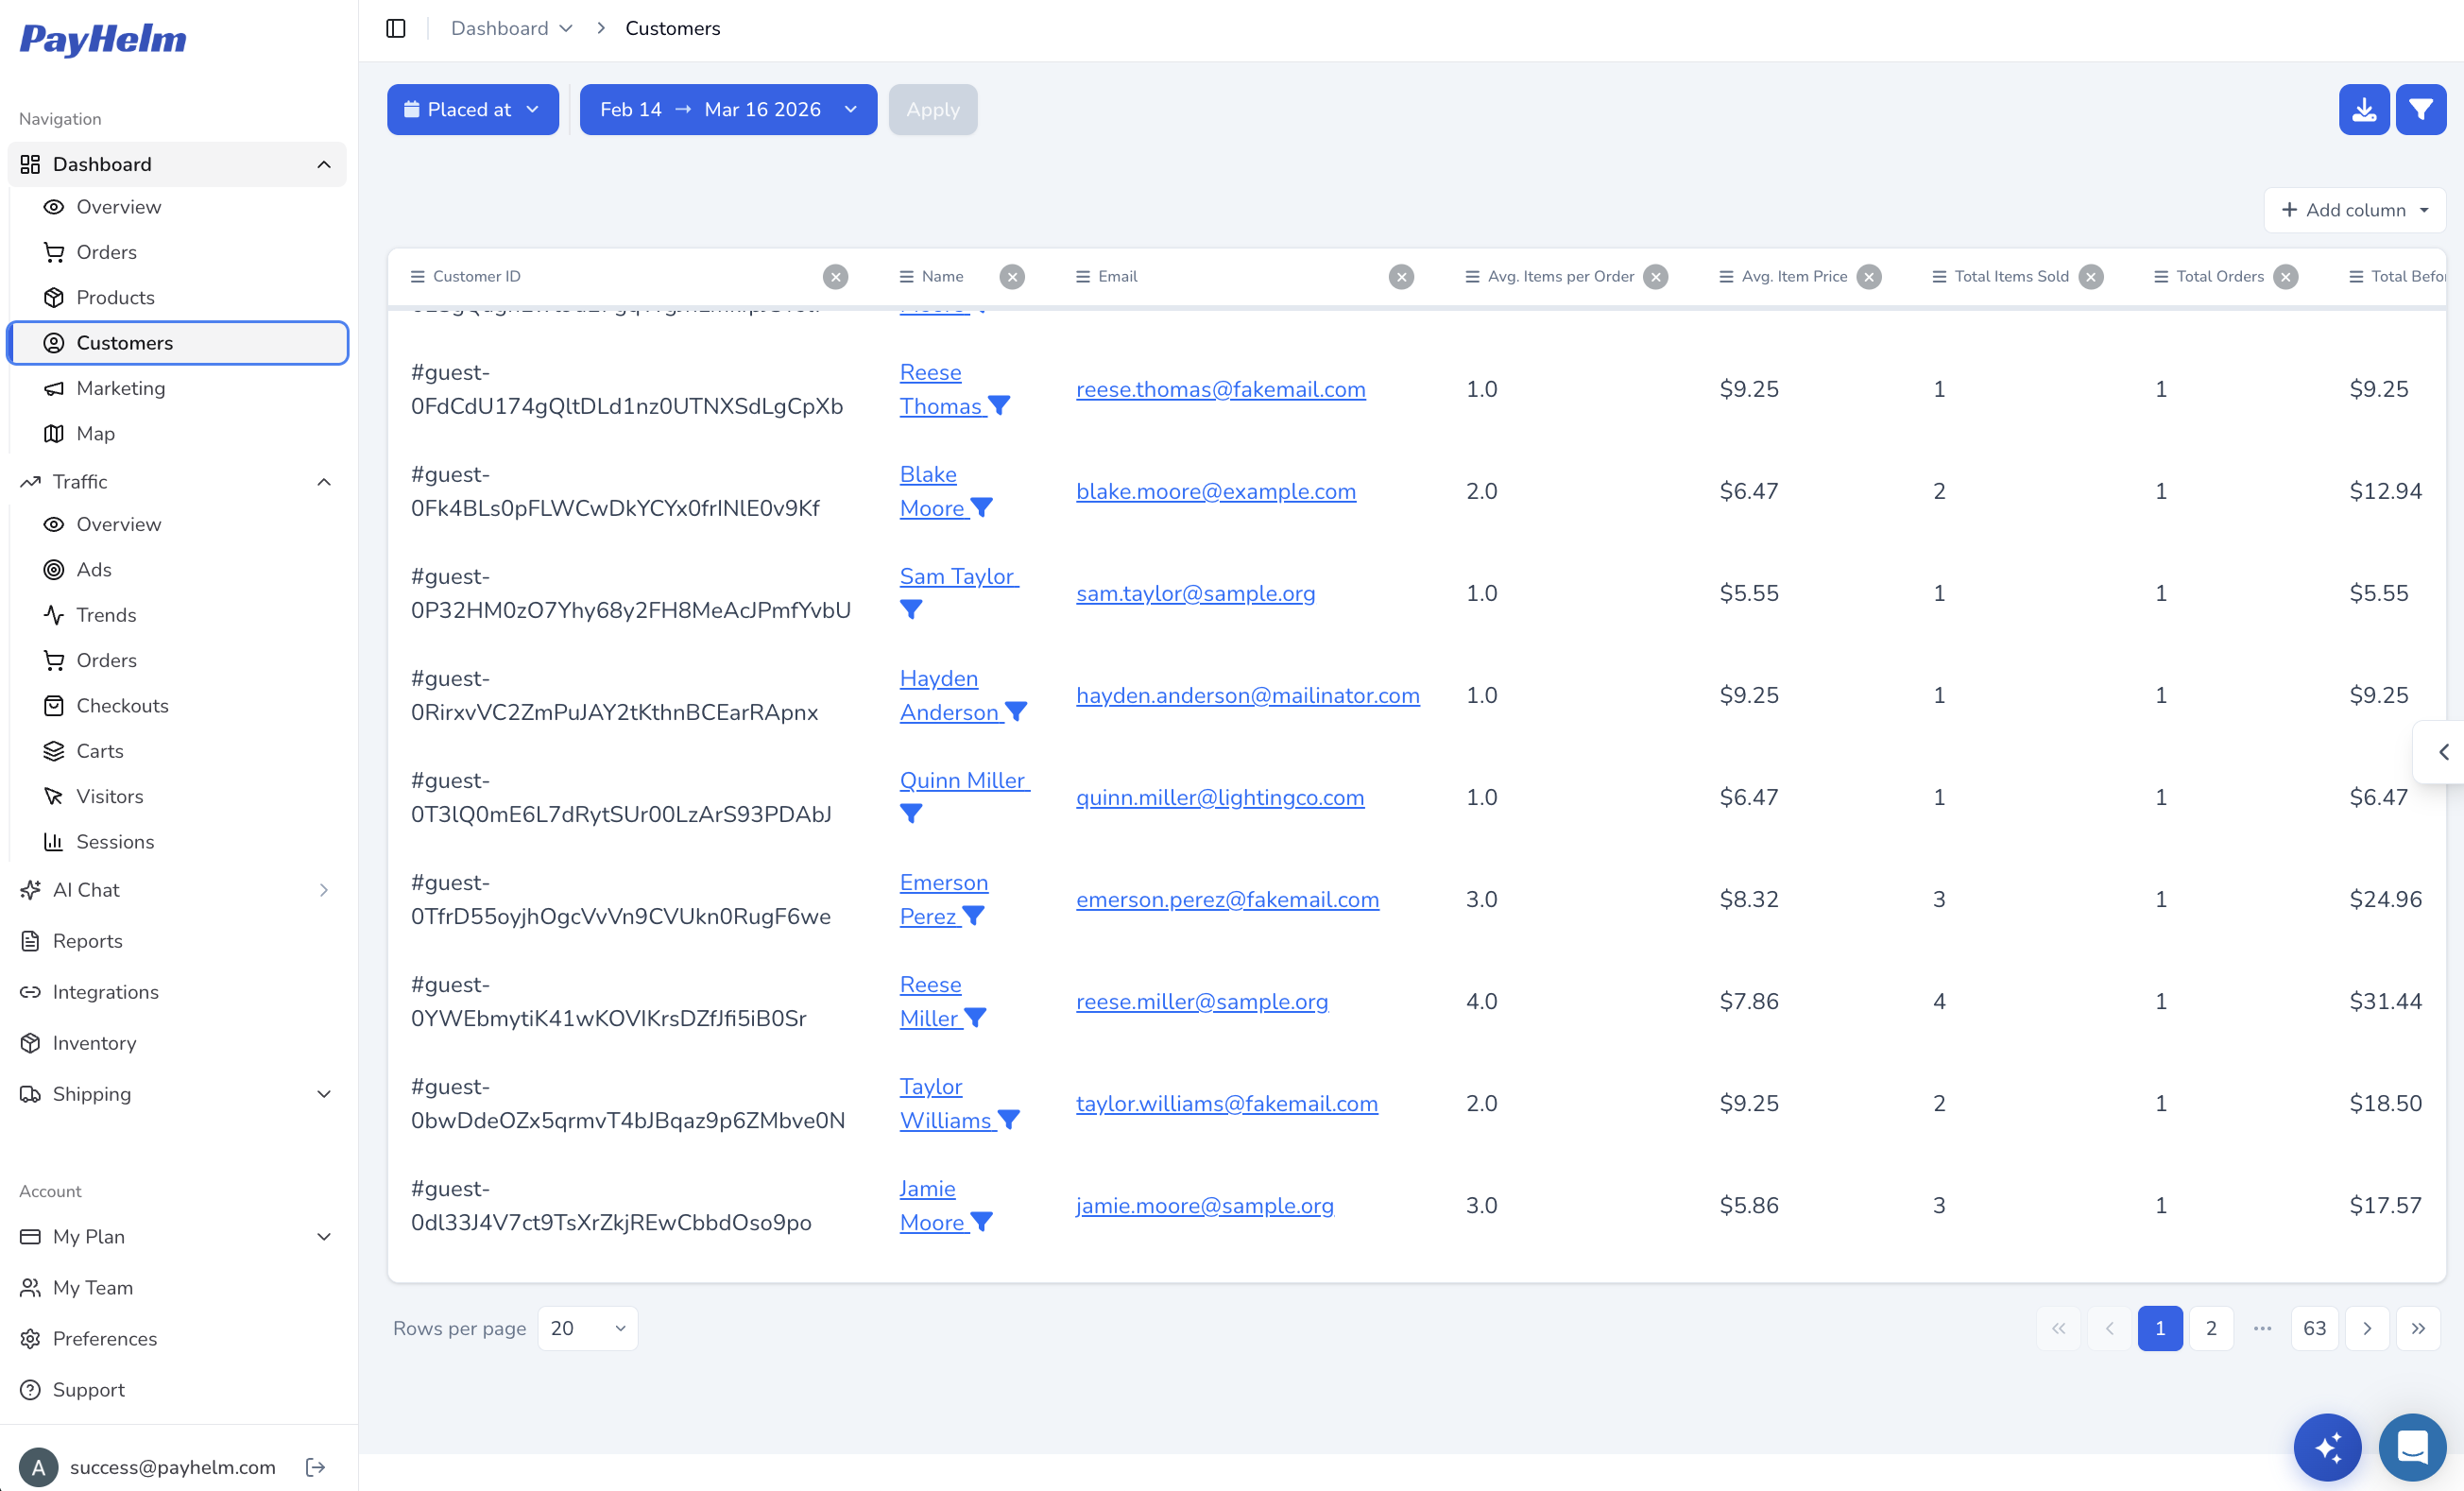
Customer Analytics
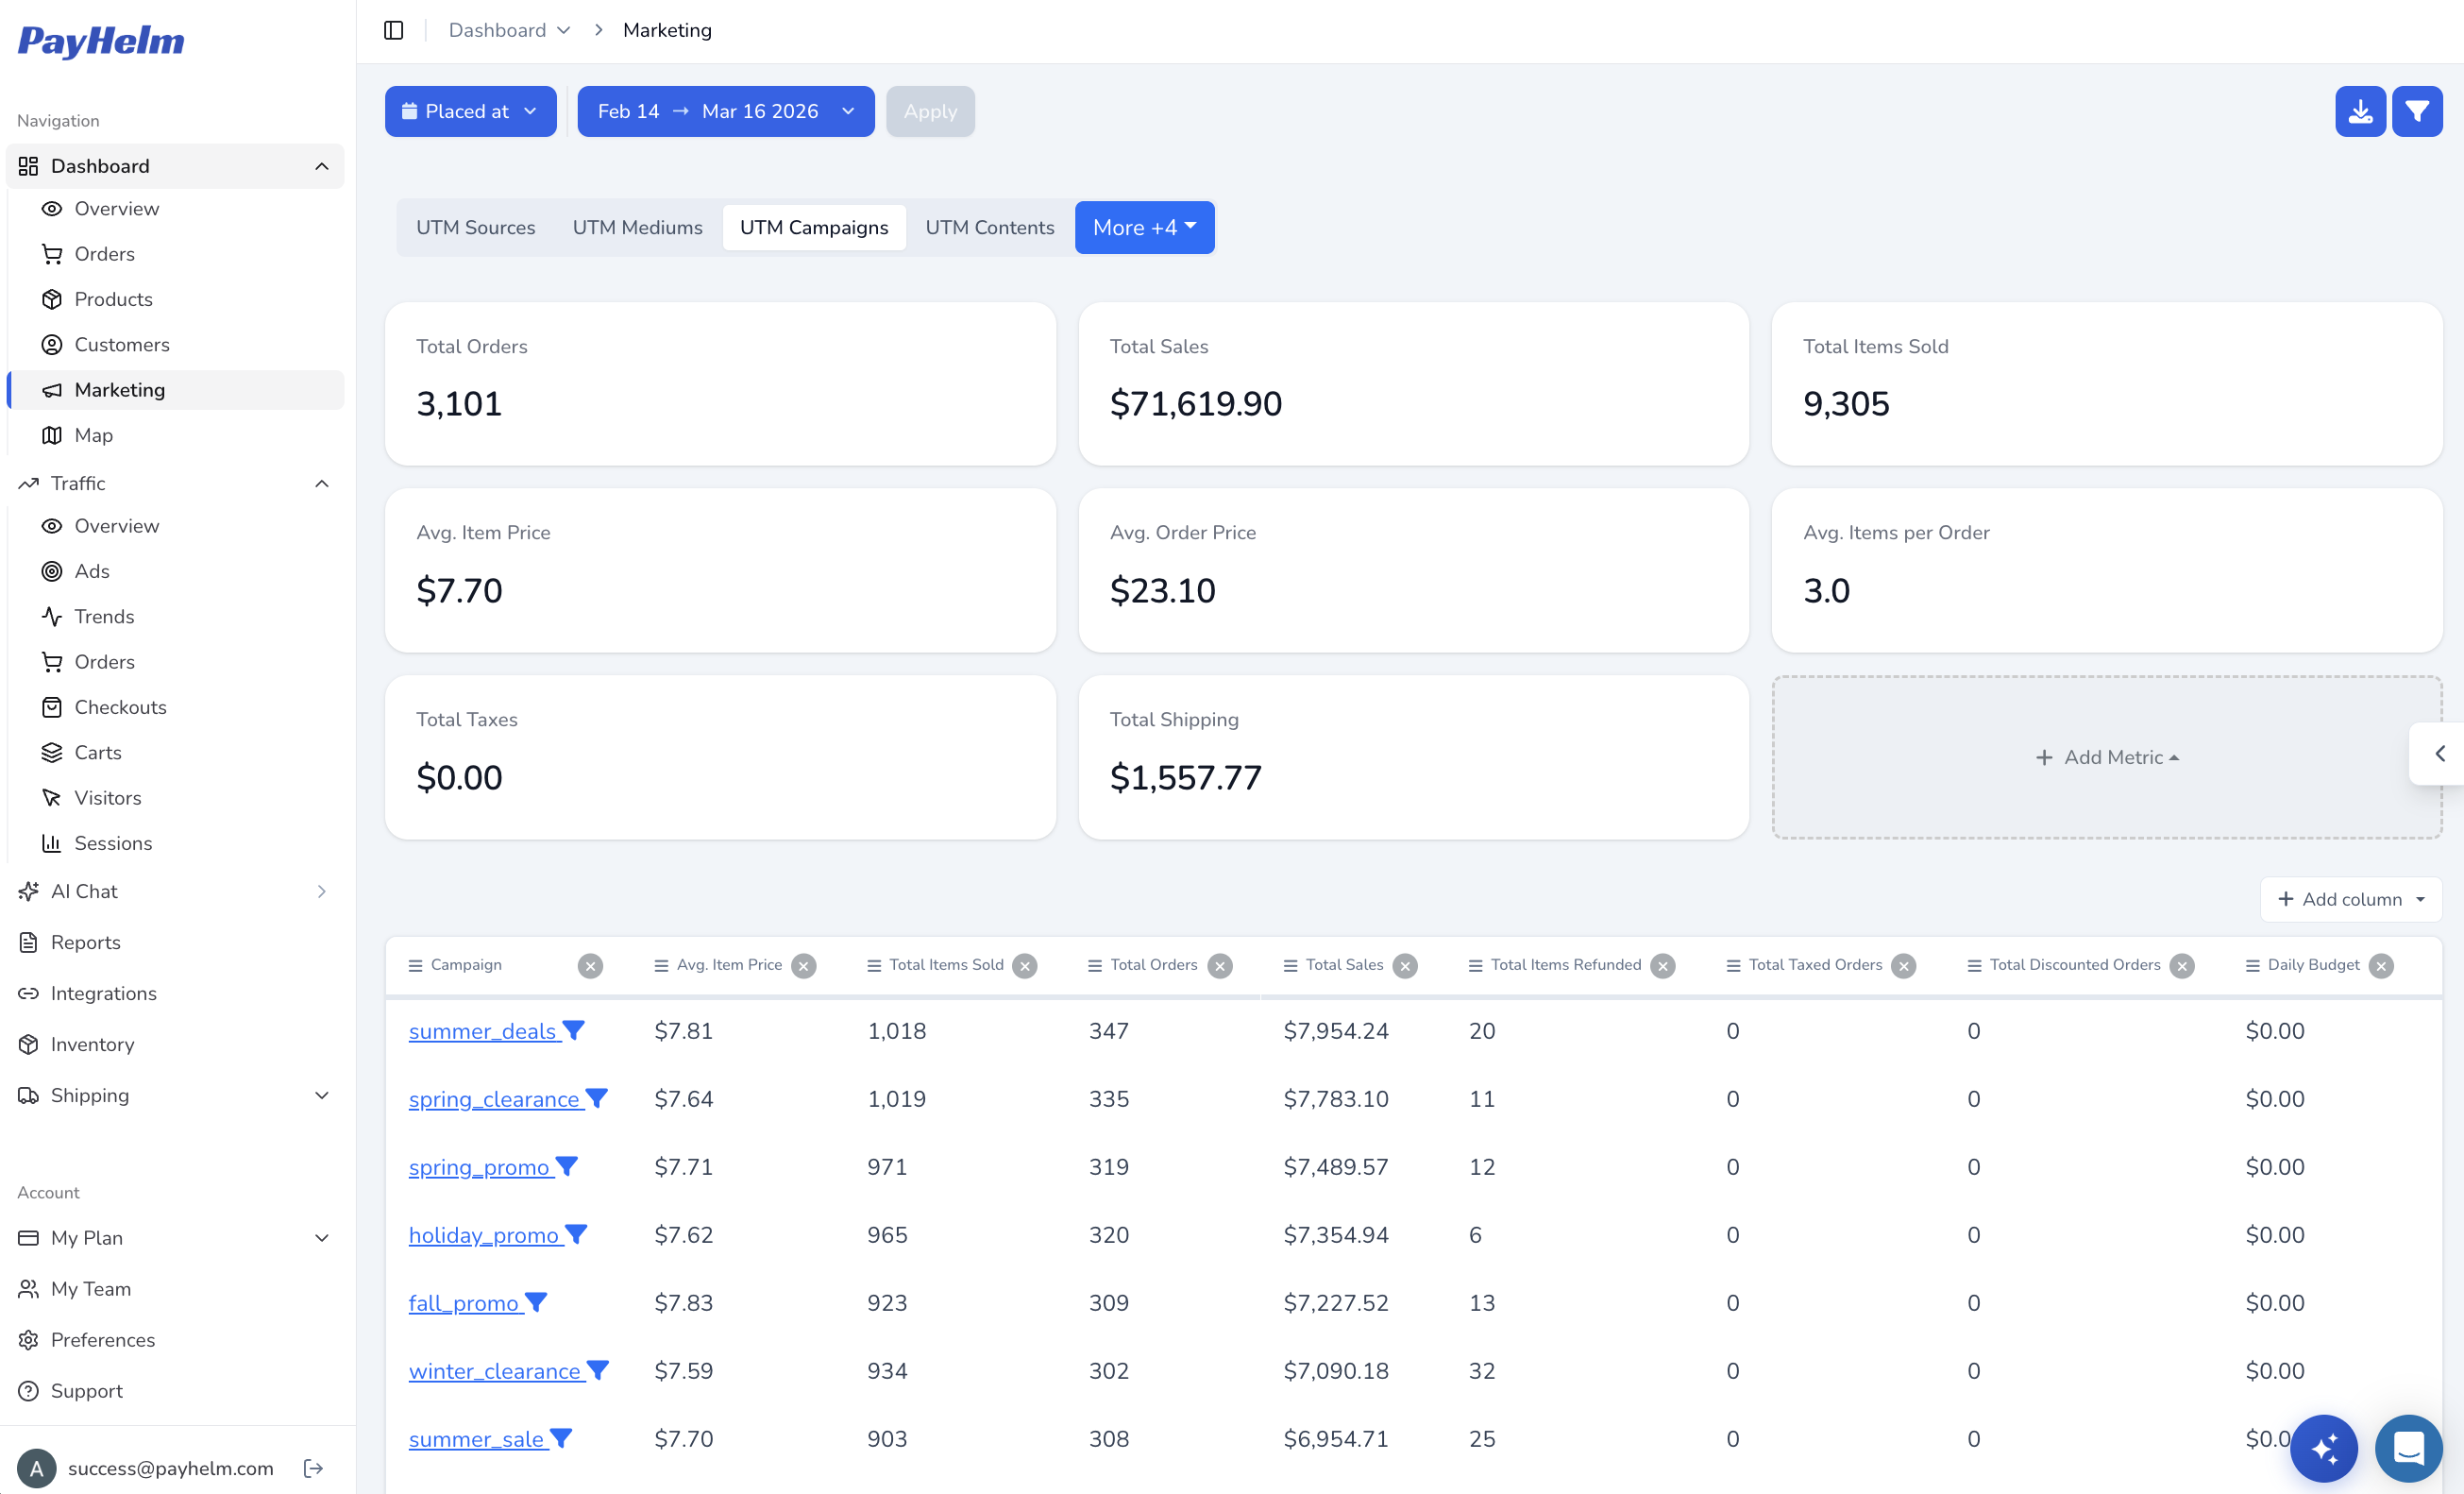
Marketing & Advertising
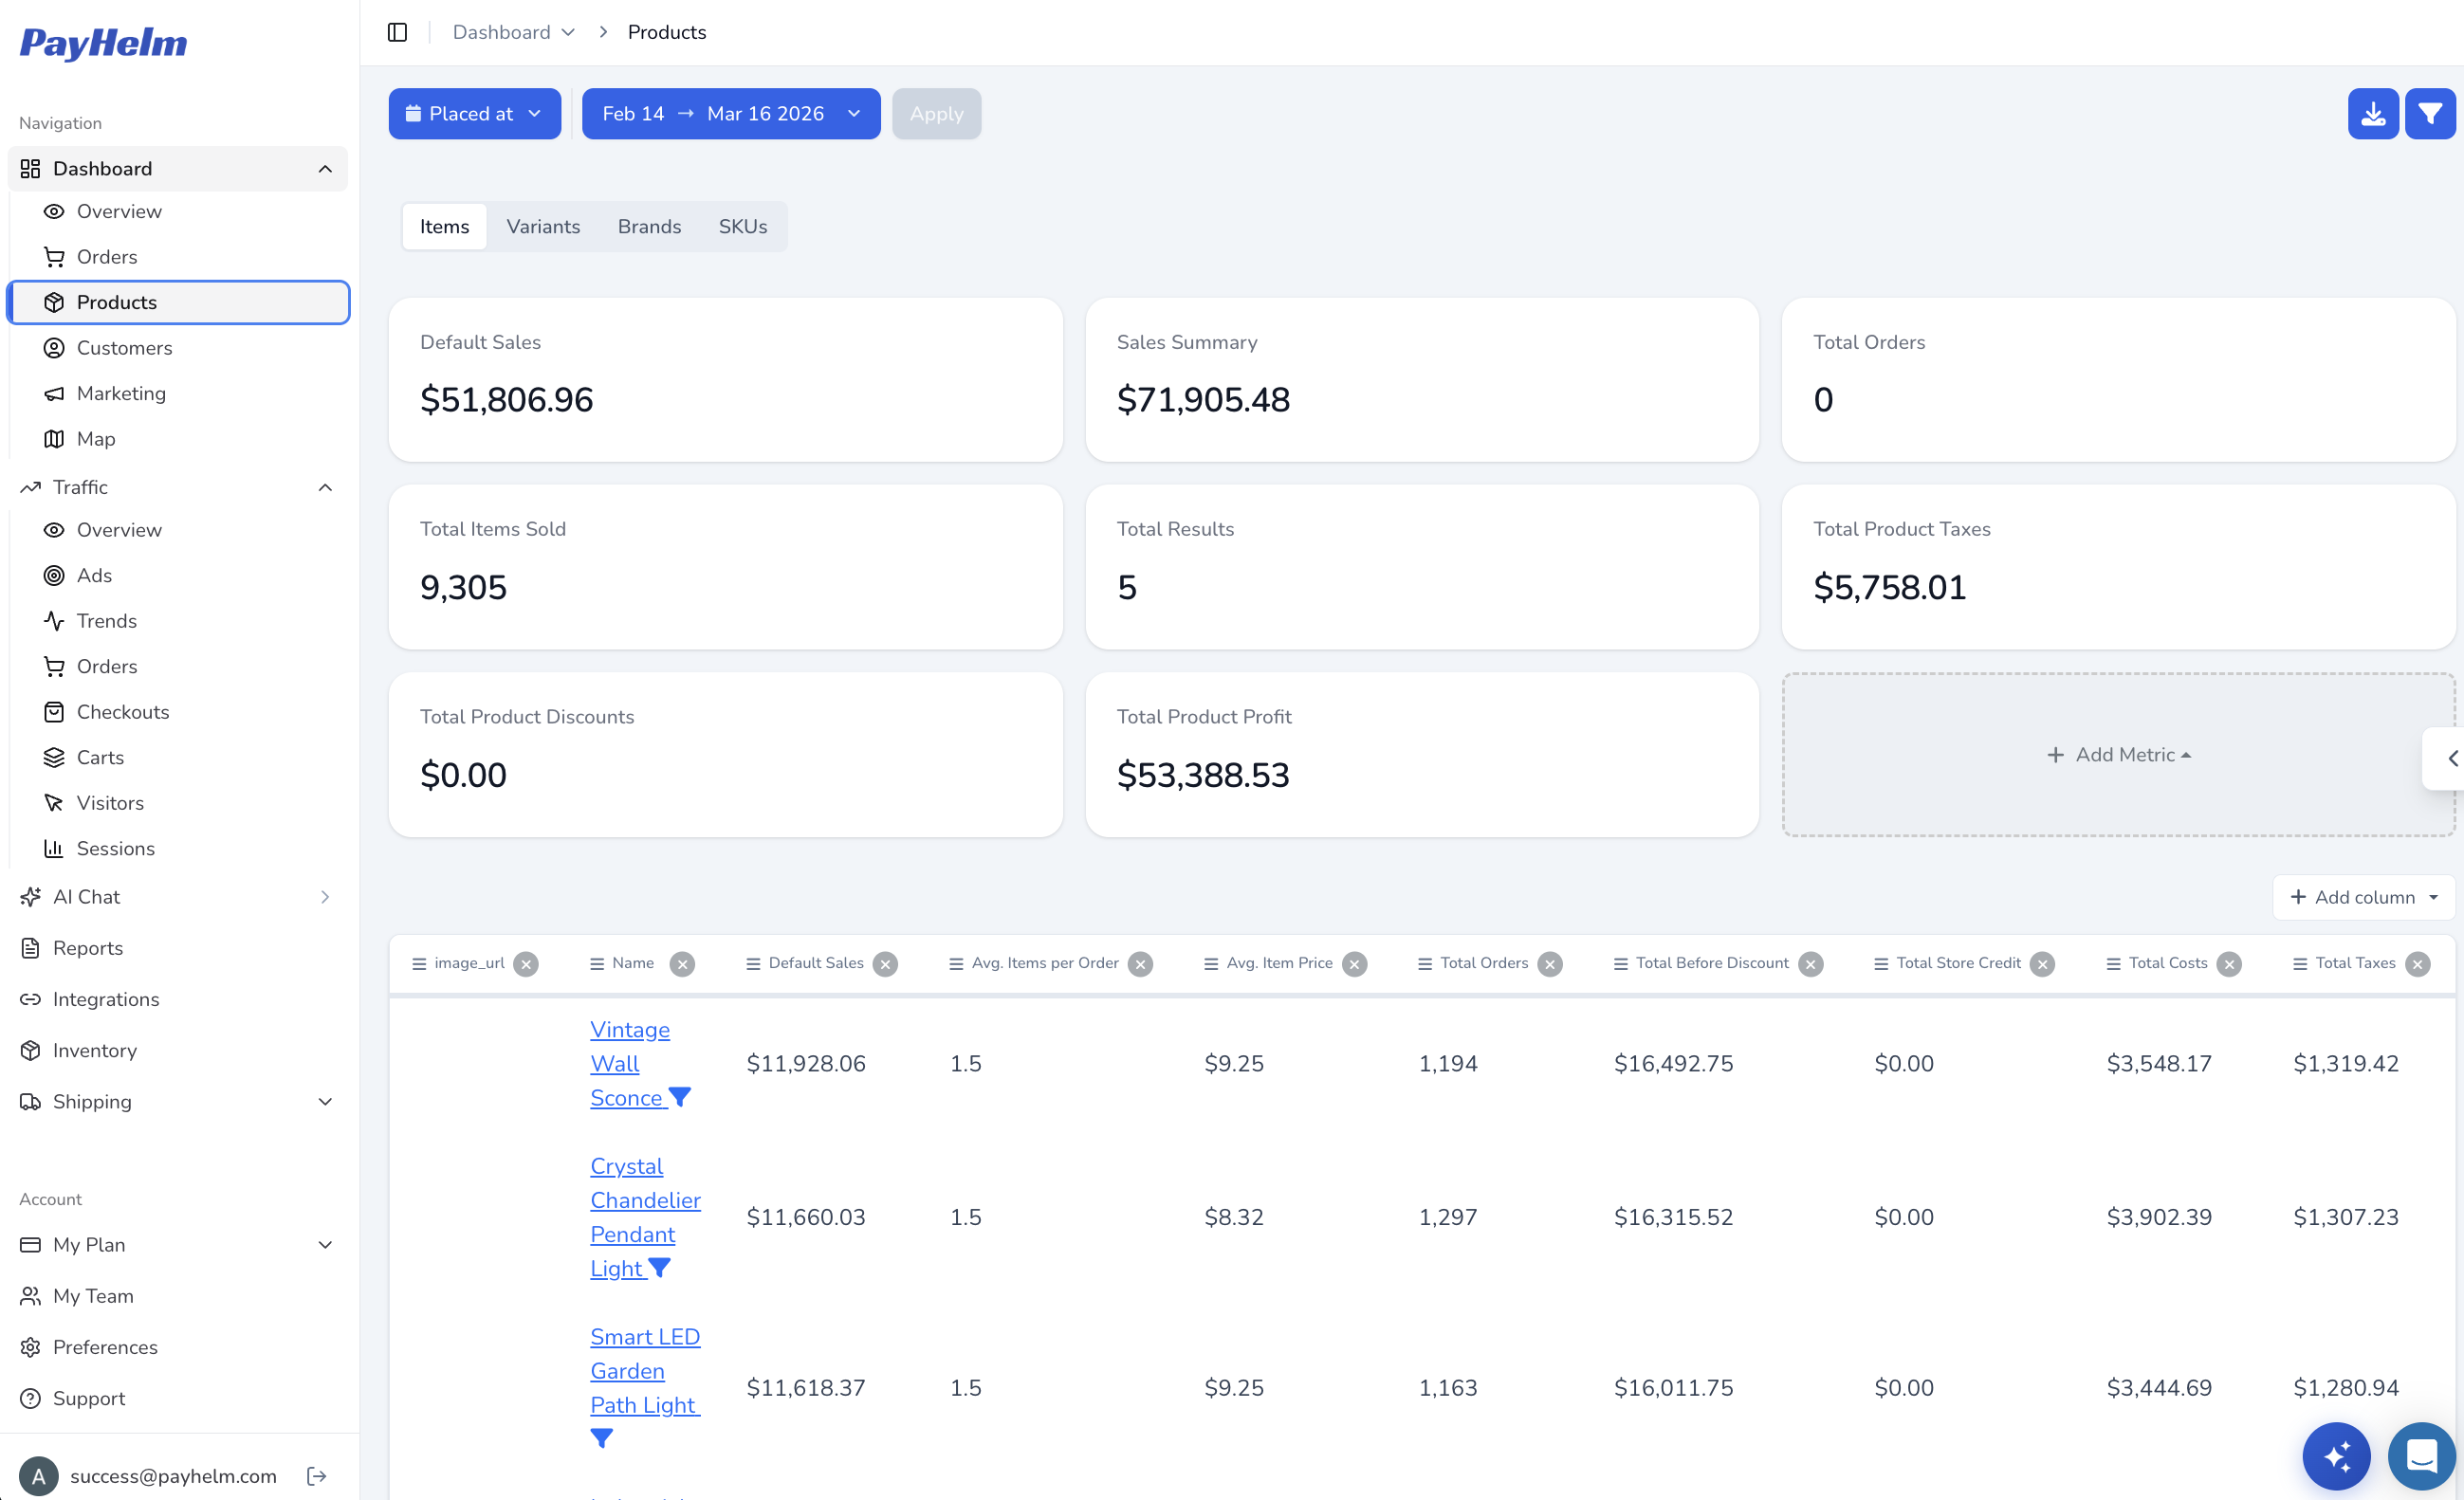
Product Performance
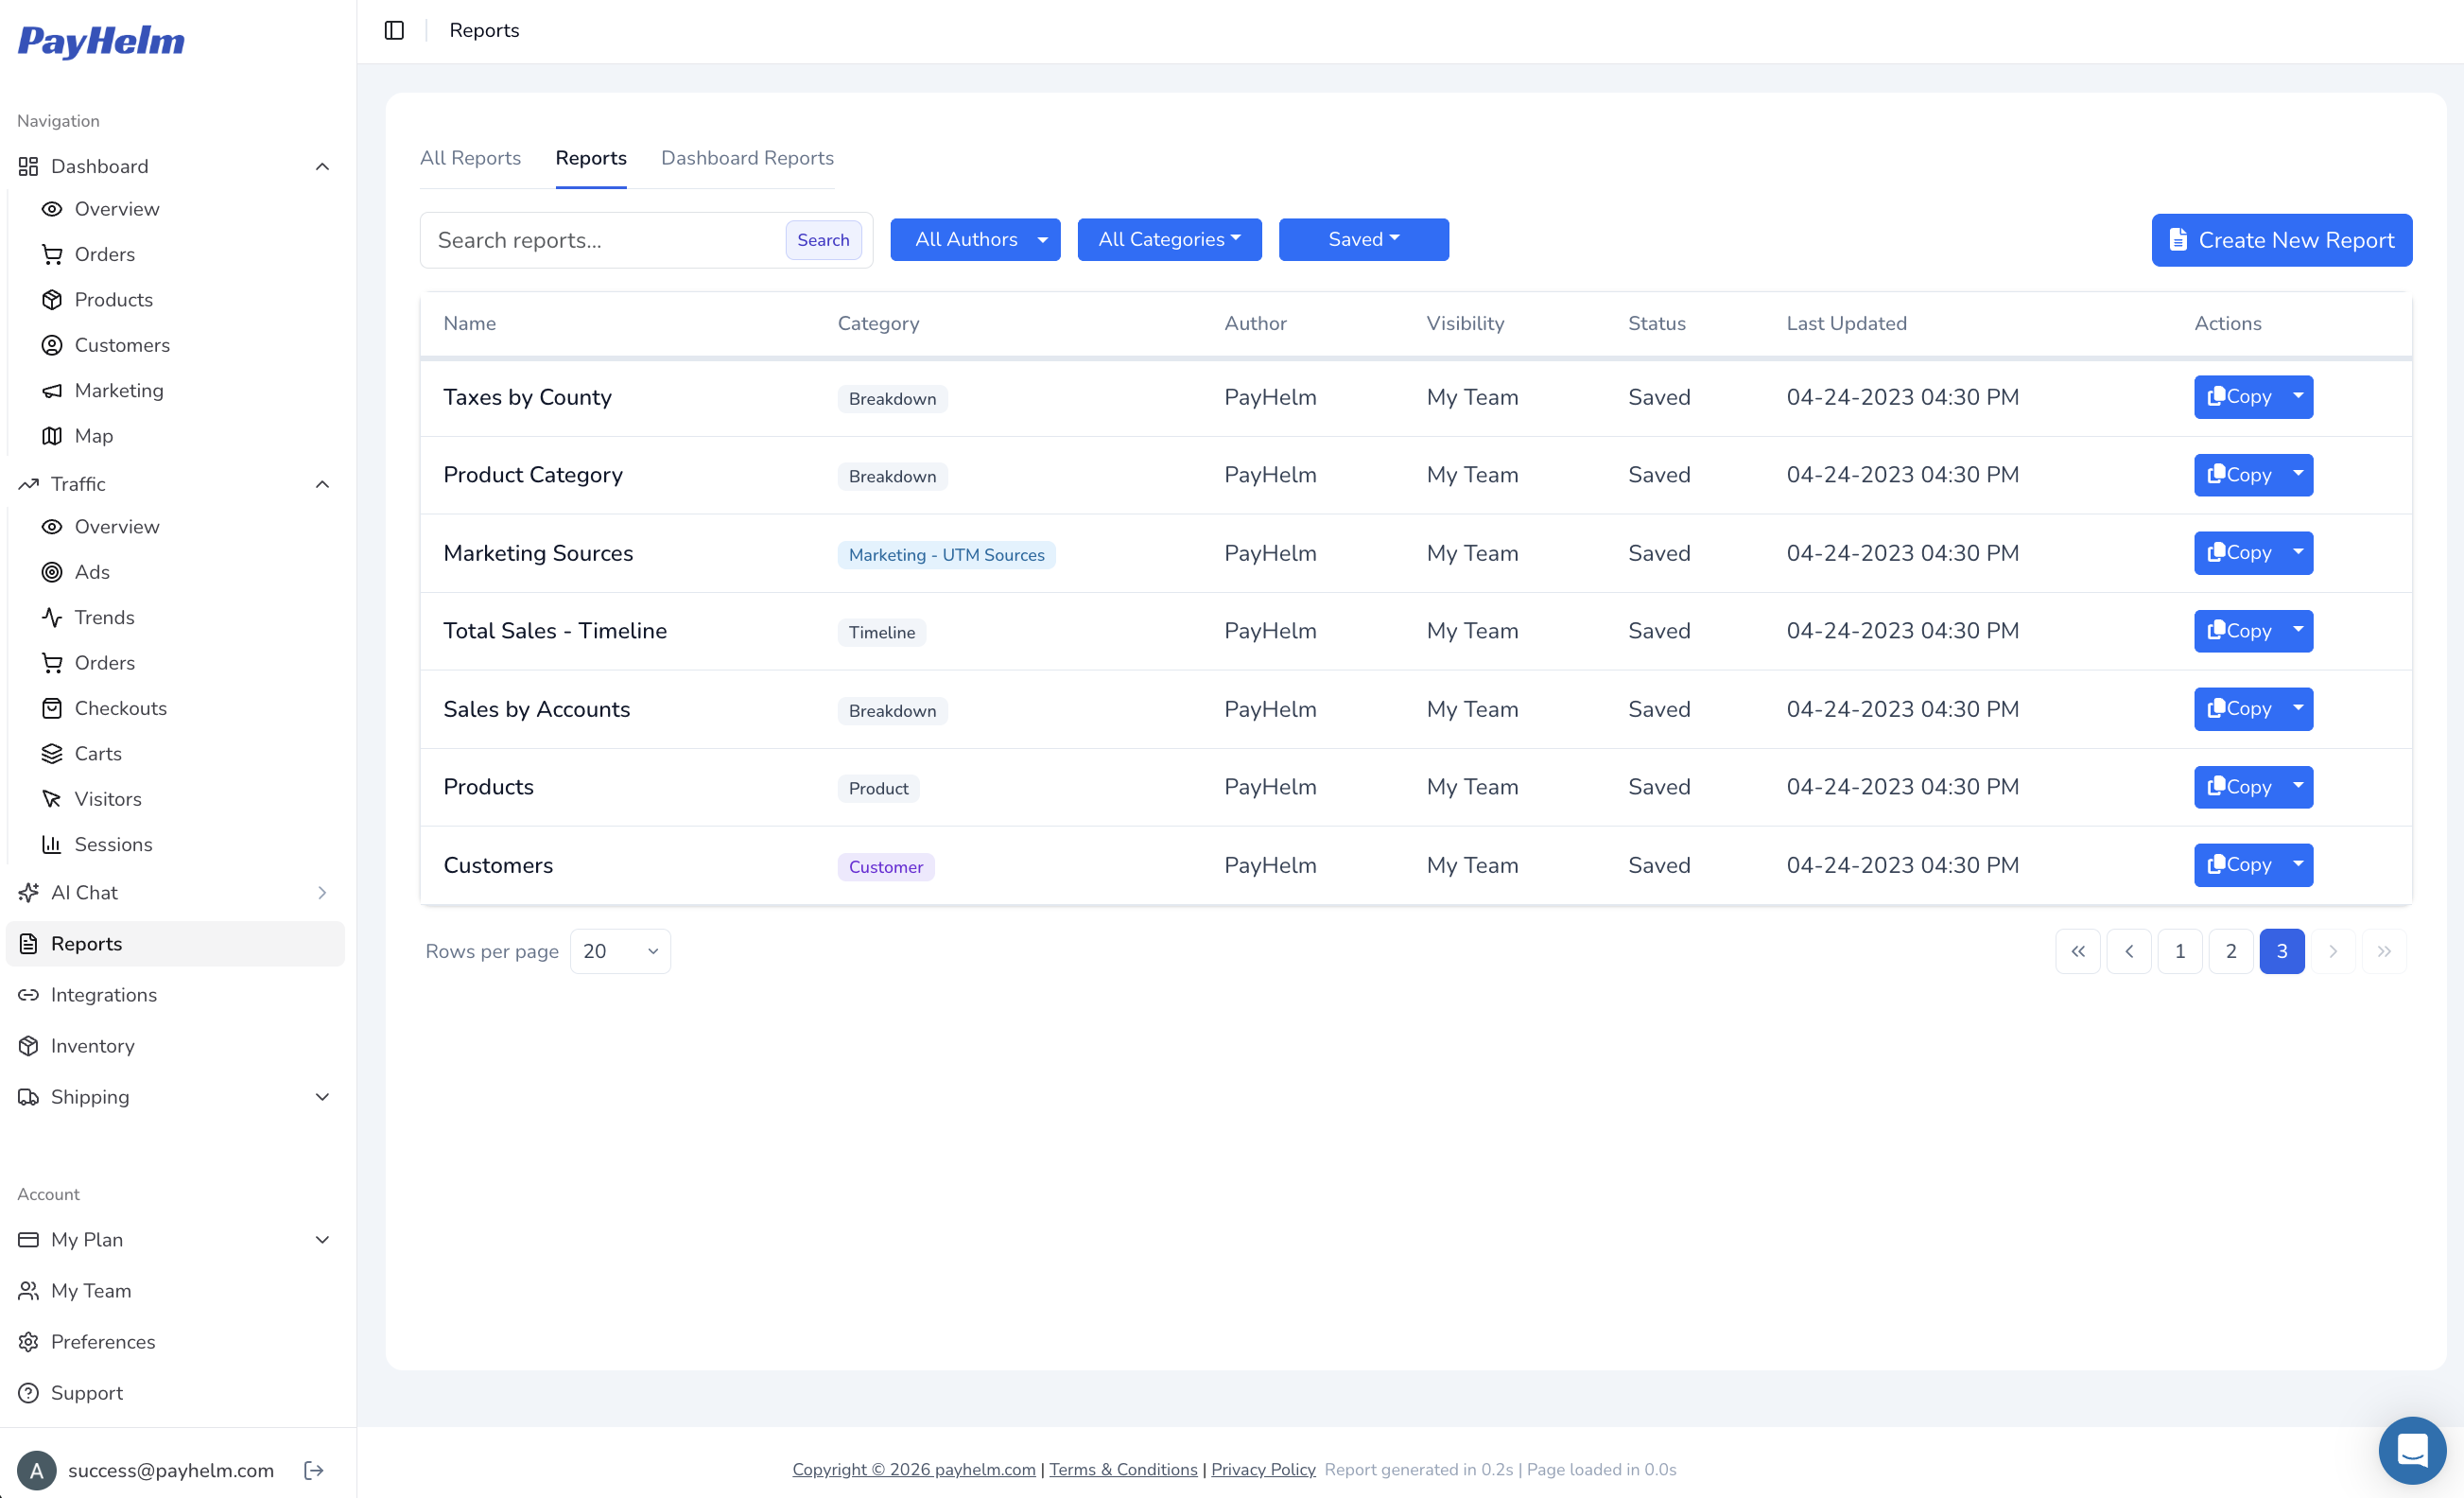
Custom Reports
AI Chat Agent
Agentic Task Manager
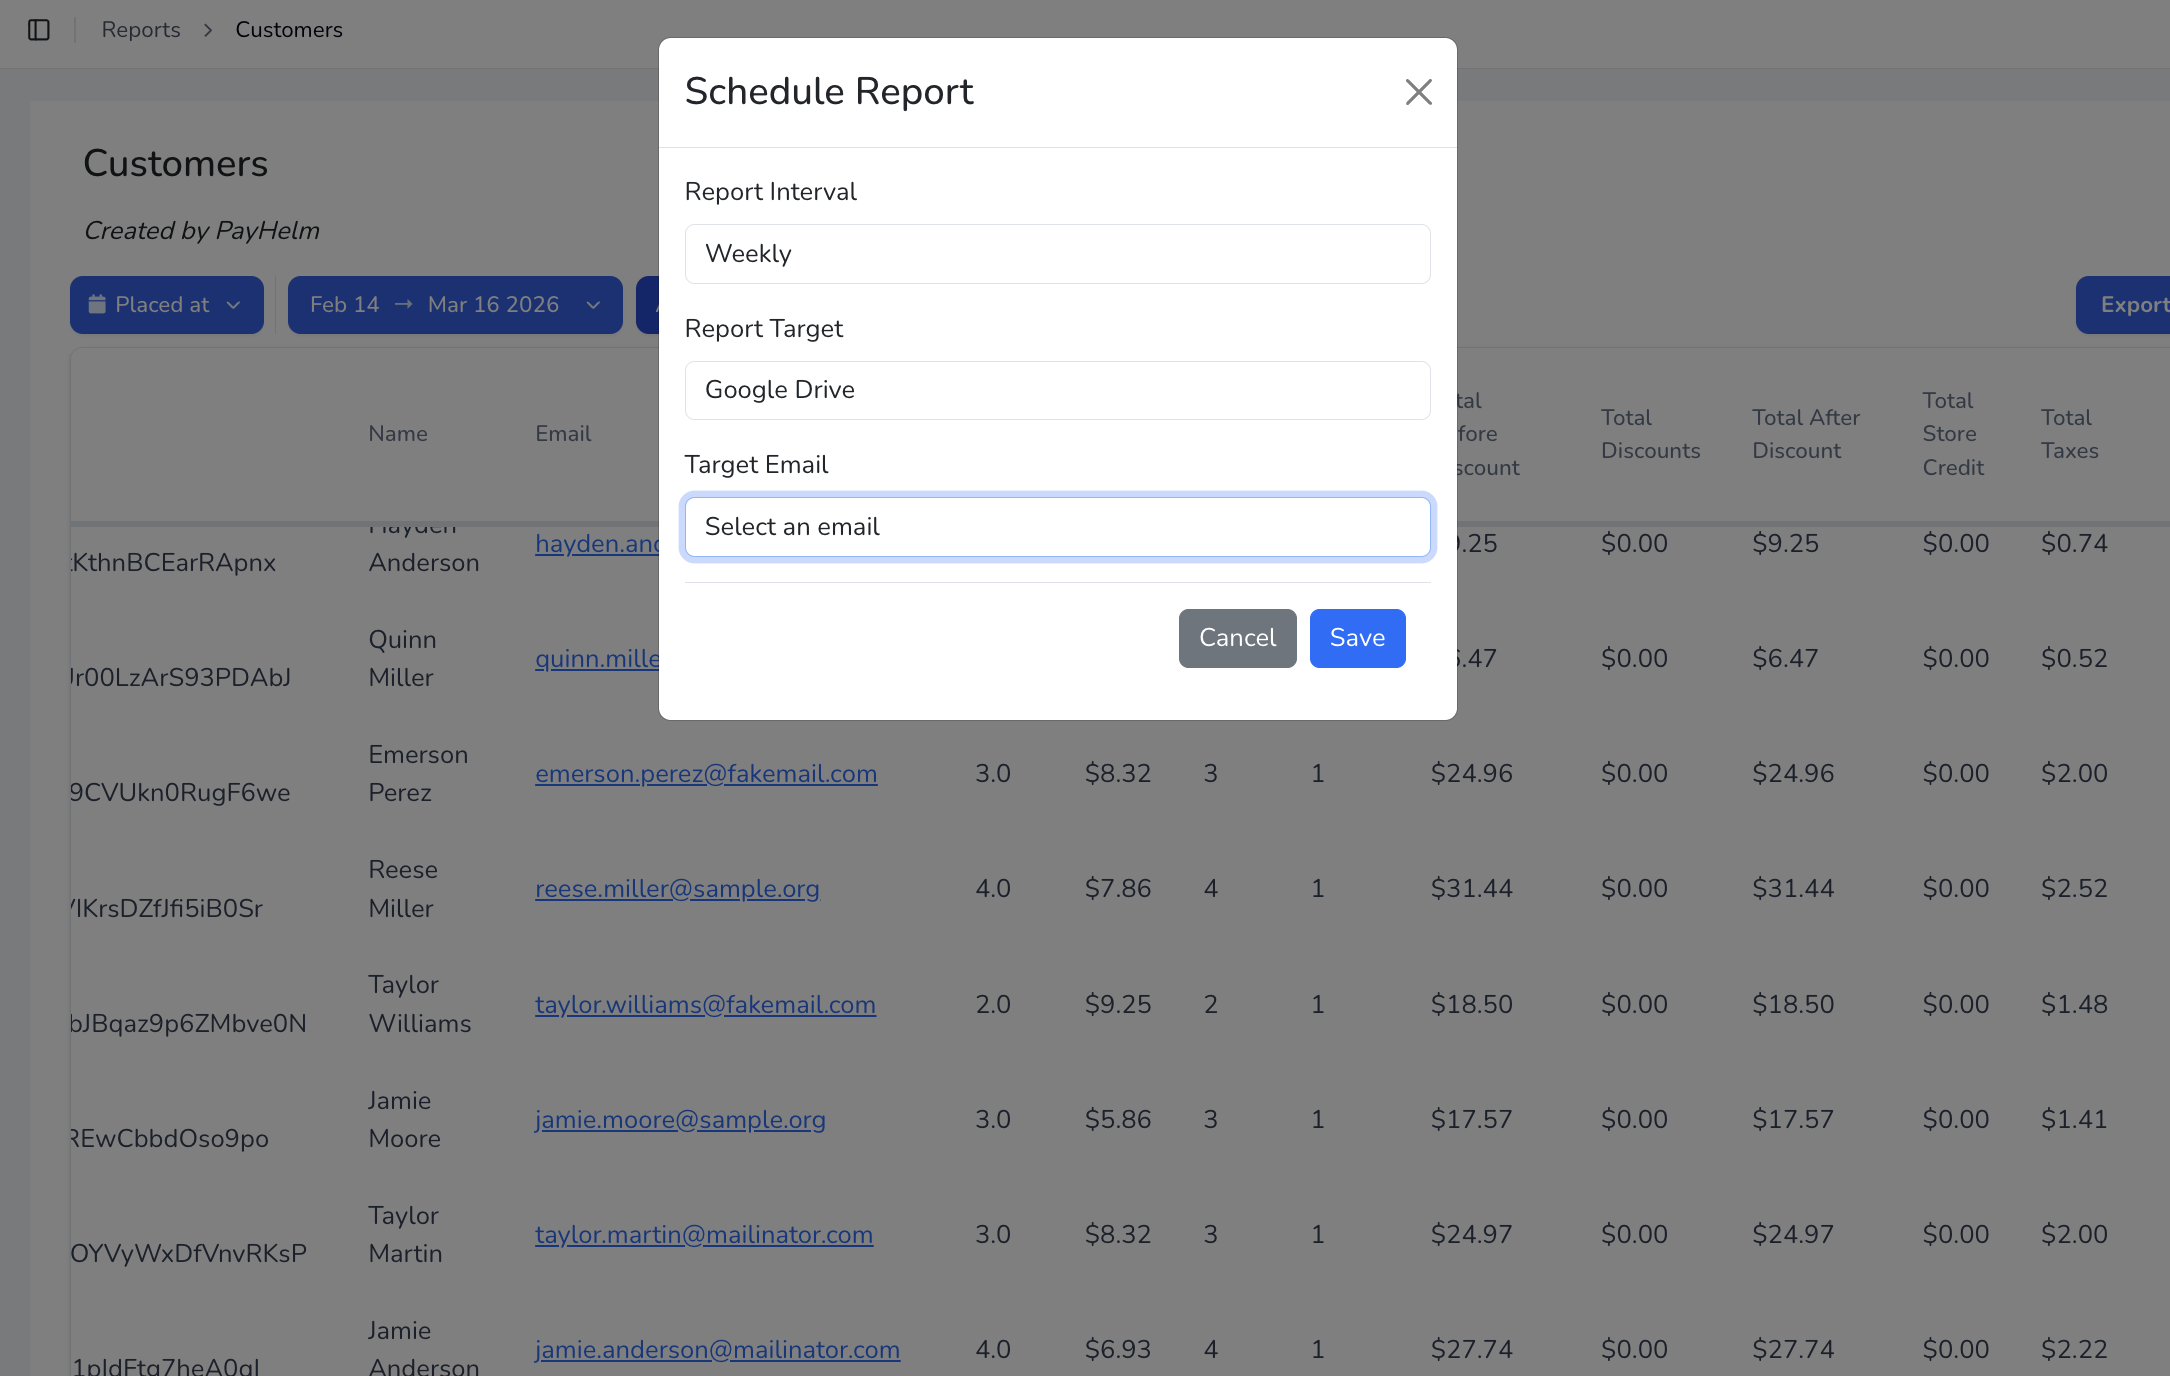
Scheduled Reports
Ready to experience these features?
Start your free trial today and see how PayHelm can transform your business analytics.