How to Tag Your Google Ads to Track in PayHelm
This article focuses on Google Ads, but the same logic applies to all advertising platforms. Understanding URL Parameters URL parameters are pieces of information added
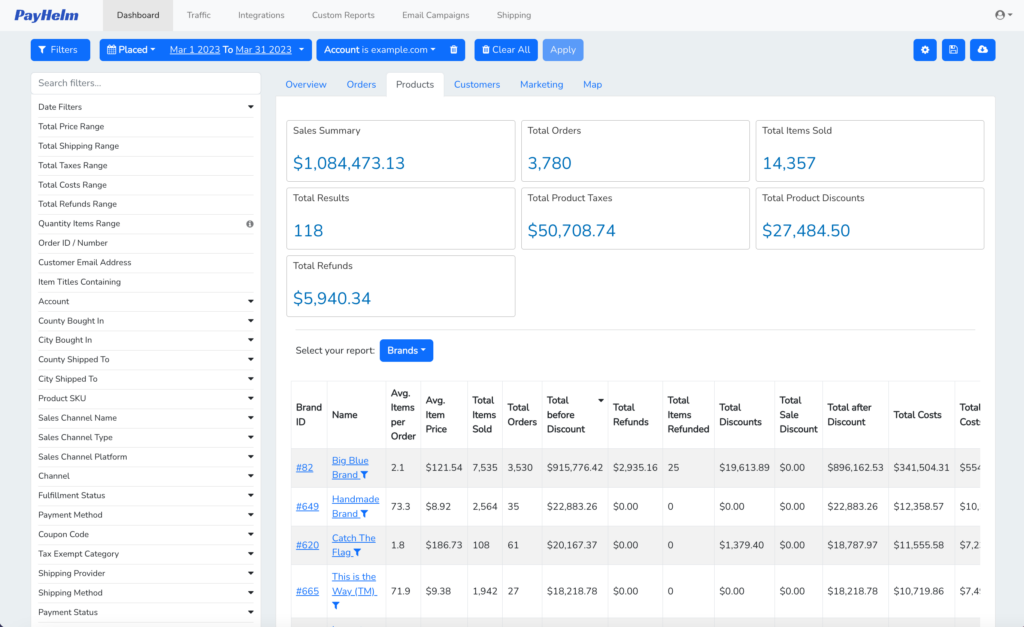
Optimize performance and capitalize on selling opportunities with powerful product analytics. Track hot and cold products, COGS, profitability, and more.


Your customers’ buying behavior changes constantly. Product segments help you monitor and respond to trends in real-time – like a sudden spike in sales for one SKU or an issue leading to increased returns for another.
Use pre-built product segments like hot, cold, most abandoned and most refunded instantly, or filter using dozens data points to create your own.
Whether you have ten SKUs or ten thousand, it’s critical to understand your product performance. Advanced product reporting in PayHelm helps you set smart pricing strategies, drive marketing decisions, identify buying trends and grow your business more profitably.
Track KPIs for individual SKUs, product categories, segments and vendors to understand how you’re doing at all levels of your business.
Monitor product data daily, weekly and over time to identify and capitalize on trends.
Analyze which products help you acquire new customers, and which ones drive repeat purchases. Plus, make sure your product strategies are profitable with automated COGS reporting.
Product status
Inventory velocity
Sell through rate
Depletion Days
Revenue
Average price
Retail value
Whether you sell online, in stores or anywhere else, PayHelm helps you collect all your product data in one place. Connect your ecommerce platform, retail point-of-sale, Amazon and more to understand how your products sell, everywhere you sell.
Compare KPIs across sales channels, see which products sell best on which platforms, and develop a smart product strategy that drives growth.
From organizing customer data into 30+ pre-built customer segments for informed decision-making, to important data about products, customers, inventory, channels, and campaigns, we have the best ecommerce analytics on the planet.
Our integrations with Google Analytics and 180 other applications enables you to track your customer journeys, analyze the performance of marketing campaigns, optimize pricing, and learn what makes your business tick.
Don’t like the way we’ve laid out our reports? PayHelm Pro also allows you to create customized ecommerce dashboards that provide personalized views about how your online store is performing. Need custom reporting? PayHelm Plus extends custom reporting functionality to every integration we support!
Book a demo to learn how our ecommerce analytics can help you gather relevant data, make informed decisions, and increase your profitability.

This article focuses on Google Ads, but the same logic applies to all advertising platforms. Understanding URL Parameters URL parameters are pieces of information added

This article focuses on Meta Ads, but the same logic applies to all advertising platforms. Understanding URL Parameters URL parameters are pieces of information added

Announcing PayHelm for WooCommerce: A Game-Changing Partnership PayHelm is excited to announce its new partnership with WooCommerce, the leading WordPress-based ecommerce platform which helps merchants

Introduction In the rapidly evolving world of e-commerce, staying ahead of the competition means having the right tools at your disposal. For sellers on the
Introduction In the modern digital marketplace, businesses are constantly seeking ways to optimize their marketing strategies and maximize their return on investment (ROI). Google Ads

Introduction Maximizing Business Performance with OpenAI and PayHelm Integration In today’s fast-paced digital economy, data is not just a buzzword; it’s a critical asset. For

Analyze your Shopify, BigCommerce, WooCommerce or PayPal store data all in one place. Connect your store to Slack, ShipStation, Google Analytics & more.