What Counts as Unusual Order Editing Activity?
Examples include sudden spikes in edits, cancellations, quantity changes, discounts, or shipping-address updates. Unusual should mean different from the business’s normal behavior, not simply above an arbitrary number.
The business context changes the meaning of an edit. Address changes may be normal for a subscription workflow, while an unexpected increase in discounts or cancellations during a quiet period may deserve a closer review.
Start by defining the decision this section needs to support. Record the metric definitions, comparison window, and owner before drawing a conclusion. That small amount of discipline makes the analysis easier to repeat and easier for another teammate to trust. It also gives the team a clear standard for deciding whether the next review shows improvement.
How AI Can Establish a Baseline for Normal Order Changes
Historical data can show expected edit frequency by day, sales volume, promotion, season, and channel. A dynamic baseline is more useful than an alert that fires whenever edits pass the same fixed threshold.
The baseline should adapt to volume and calendar effects while preserving enough history for comparison. Separating edits by type and source also prevents a normal customer-service workflow from hiding a different, more concerning pattern.
The comparison becomes more useful when the underlying data is complete and consistently labeled. Check for missing records, delayed updates, and changes in platform definitions before treating movement as a business signal. When the inputs are clear, an operator can explain the result without rebuilding the analysis manually. This check is especially important when several connected platforms refresh on different schedules.
Detecting Spikes and Anomalies in Edited, Cancelled, or Modified Orders
AI can compare current activity with expected levels and analyze each change type separately. Cancellations doubling and address changes rising may point to different problems.
An alert should explain both the deviation and the evidence behind it. Showing the expected count, observed count, affected channel, and representative orders makes it possible to decide whether the right response is investigation, correction, or no action.
Break the result into the dimensions that can change the outcome, such as product, channel, location, customer group, or time period. A concentrated pattern usually points to a more actionable cause than a broad average. Keep the original total visible so the team can connect the detail back to business impact. The resulting view helps the right owner act without losing the context of the overall business.
How to Investigate the Orders Behind an AI-Detected Anomaly
Drill into the affected orders and look for shared products, channels, promotions, time periods, or fulfillment statuses. A concise AI summary can reveal what the anomalous orders have in common.
Investigation should protect customer privacy and preserve an audit trail. Review the smallest useful set of orders, compare them with normal orders, and document whether the anomaly came from a campaign, a staff action, an integration, or a customer-facing problem.
Interpret the finding as evidence to investigate, not as proof of a single cause. Compare it with a relevant control period and ask what changed in the workflow around the same time. This approach reduces false alarms while preserving the urgency of issues that affect customers or cash flow. It also makes the eventual recommendation easier to explain to stakeholders.
Turning Order-Editing Alerts Into an Operational Monitoring System
Regular checks can focus attention only when behavior moves meaningfully outside its expected range. Tracking anomalies over time helps separate an isolated mistake from a recurring process issue.
Over time, a history of alerts creates a feedback loop for improving thresholds and controls. Repeated false positives can be narrowed, while recurring confirmed anomalies can become a documented check in the order-management process.
Turn the insight into a small next step with a named owner and a date for review. The team can test a process change, adjust a planning assumption, or request better source data. Measuring the same section again shows whether the action solved the problem or only moved it elsewhere. A short feedback loop is more useful than a one-time report that is never revisited.
Monitoring Unusual Order Activity With PayHelm
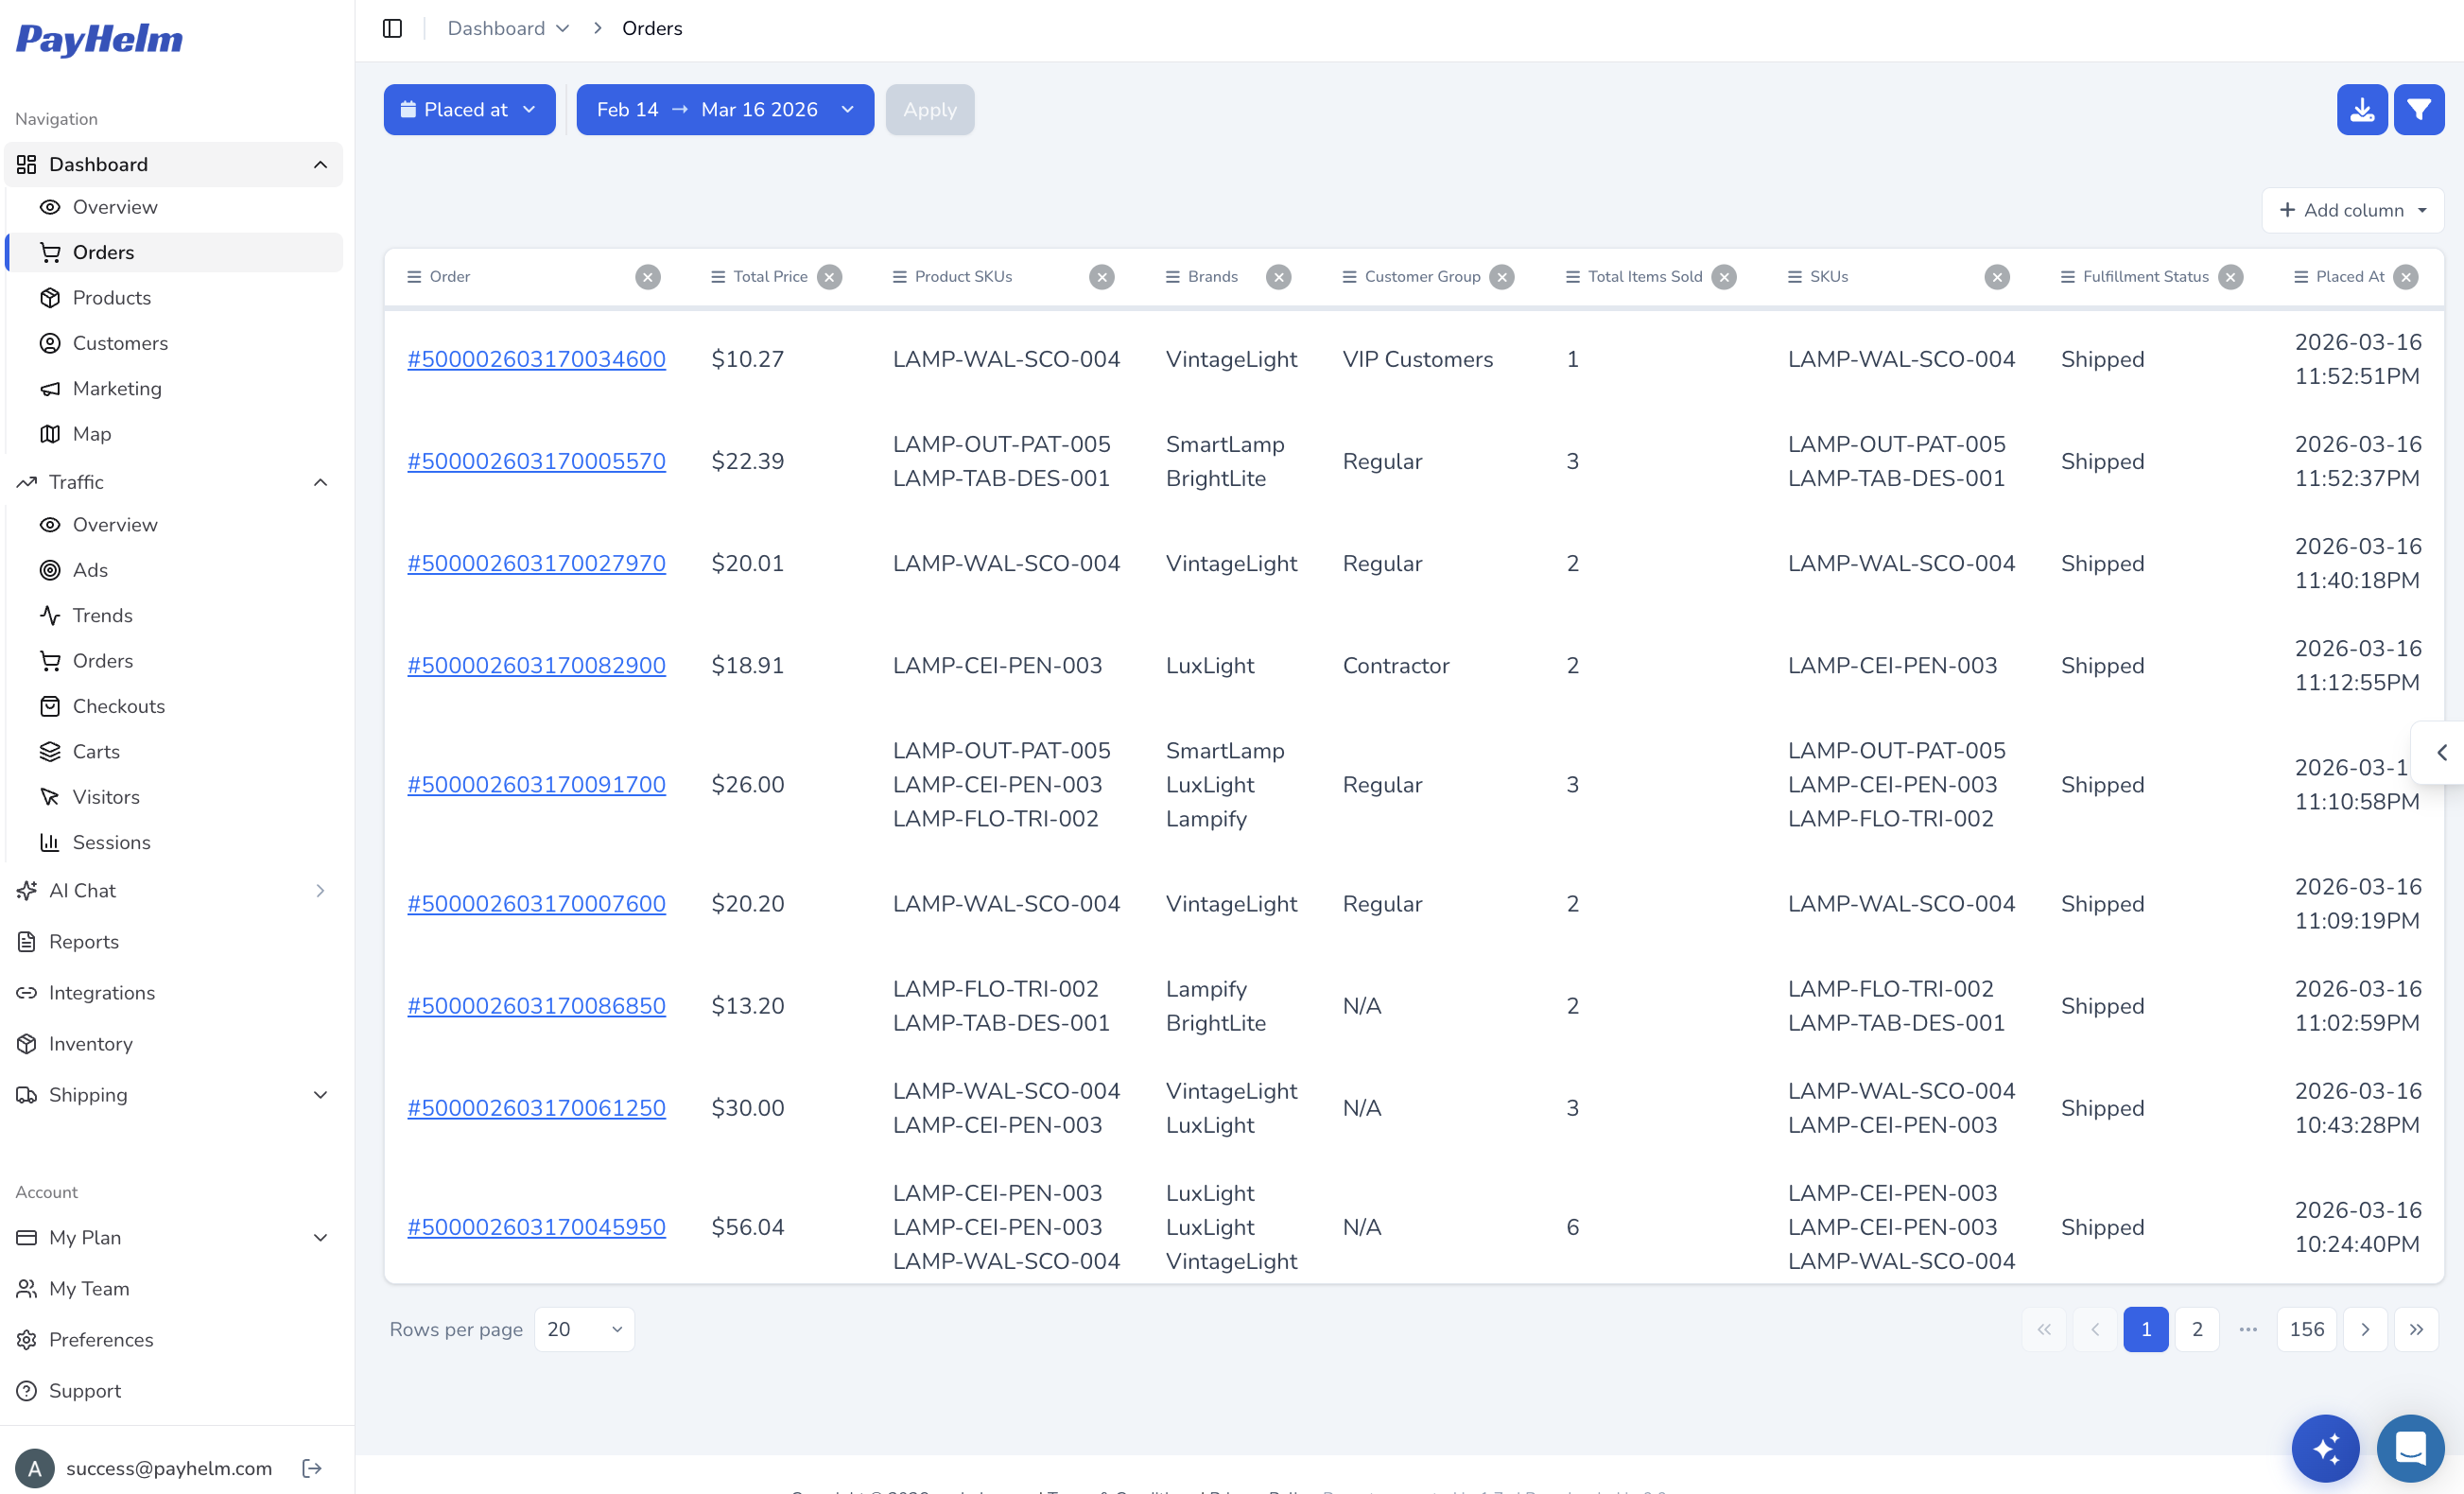
PayHelm can compare current order activity with connected historical data. Ask, “Are edited or cancelled orders unusually high today, and which orders explain the change?” The answer gives an operator a focused investigation list. The same investigation can be extended through PayHelm’s ecommerce analytics when the team needs more order context.
Follow-up prompts can separate cancellations from quantity edits or shipping changes and compare each against a prior period. That gives an operator a practical starting point without requiring a separate anomaly dashboard for every order field.
PayHelm is most useful when the question moves from a headline to a decision. Start with the broad result, ask a focused follow-up, and verify the supporting records before acting. That workflow keeps AI-generated analysis practical, transparent, and aligned with the operating team’s judgment. It gives the team a repeatable path from an observation to a responsible operational decision.