What Makes an Operations Report Board-Ready?
A board needs trends, material changes, business impact, risks, and progress against objectives—not pages of operational detail. Concise context helps non-operational stakeholders understand why a KPI matters.
Board materials should be concise without becoming vague. Include the comparison period, the business implication, the action underway, and the decision or support needed so the report can stand on its own outside the operations team.
Start by defining the decision this section needs to support. Record the metric definitions, comparison window, and owner before drawing a conclusion. That small amount of discipline makes the analysis easier to repeat and easier for another teammate to trust. It also gives the team a clear standard for deciding whether the next review shows improvement.
How AI Can Turn Operational KPIs Into an Executive-Level Narrative
AI can summarize many KPIs into the few developments that matter most, translating fulfillment, revenue, margin, and efficiency into business implications while retaining supporting numbers.
The strongest narrative preserves the numbers that support the conclusion while removing repetitive detail. It can translate a fulfillment delay into customer or revenue risk, or translate a margin movement into a pricing, product, or cost question.
The comparison becomes more useful when the underlying data is complete and consistently labeled. Check for missing records, delayed updates, and changes in platform definitions before treating movement as a business signal. When the inputs are clear, an operator can explain the result without rebuilding the analysis manually. This check is especially important when several connected platforms refresh on different schedules.
Automatically Explaining Significant Changes, Trends, and Exceptions
Period comparisons can surface material movement, then drill into products, channels, customers, or operations contributing to it. Baselines help separate normal fluctuation from board-worthy developments.
Material changes deserve a traceable explanation rather than a confident guess. Ask the system to show the segments contributing to the movement and identify what data is missing before accepting a proposed cause.
Break the result into the dimensions that can change the outcome, such as product, channel, location, customer group, or time period. A concentrated pattern usually points to a more actionable cause than a broad average. Keep the original total visible so the team can connect the detail back to business impact. The resulting view helps the right owner act without losing the context of the overall business.
Combining Data From Multiple Ecommerce Platforms Into One Report
Consolidating stores, marketplaces, ads, and operational systems avoids manual exports. Standardized metrics provide a company-wide view while preserving platform detail for follow-up questions.
Standardization should not erase important platform differences. A board-level total can be paired with a channel appendix or drill-down so leadership sees the combined outcome and the team can still diagnose the source.
Interpret the finding as evidence to investigate, not as proof of a single cause. Compare it with a relevant control period and ask what changed in the workflow around the same time. This approach reduces false alarms while preserving the urgency of issues that affect customers or cash flow. It also makes the eventual recommendation easier to explain to stakeholders.
How to Automate Recurring Board and Leadership Reporting
Generate a consistent first draft weekly, monthly, or quarterly. Leadership should still review interpretation, sensitive conclusions, and recommendations before distribution.
Set the reporting calendar around the decision it supports, not only around the availability of a dashboard. A draft generated ahead of the meeting leaves time for owners to verify numbers, add qualitative context, and correct unusual data.
Turn the insight into a small next step with a named owner and a date for review. The team can test a process change, adjust a planning assumption, or request better source data. Measuring the same section again shows whether the action solved the problem or only moved it elsewhere. A short feedback loop is more useful than a one-time report that is never revisited.
Automating Leadership Reporting With PayHelm AI
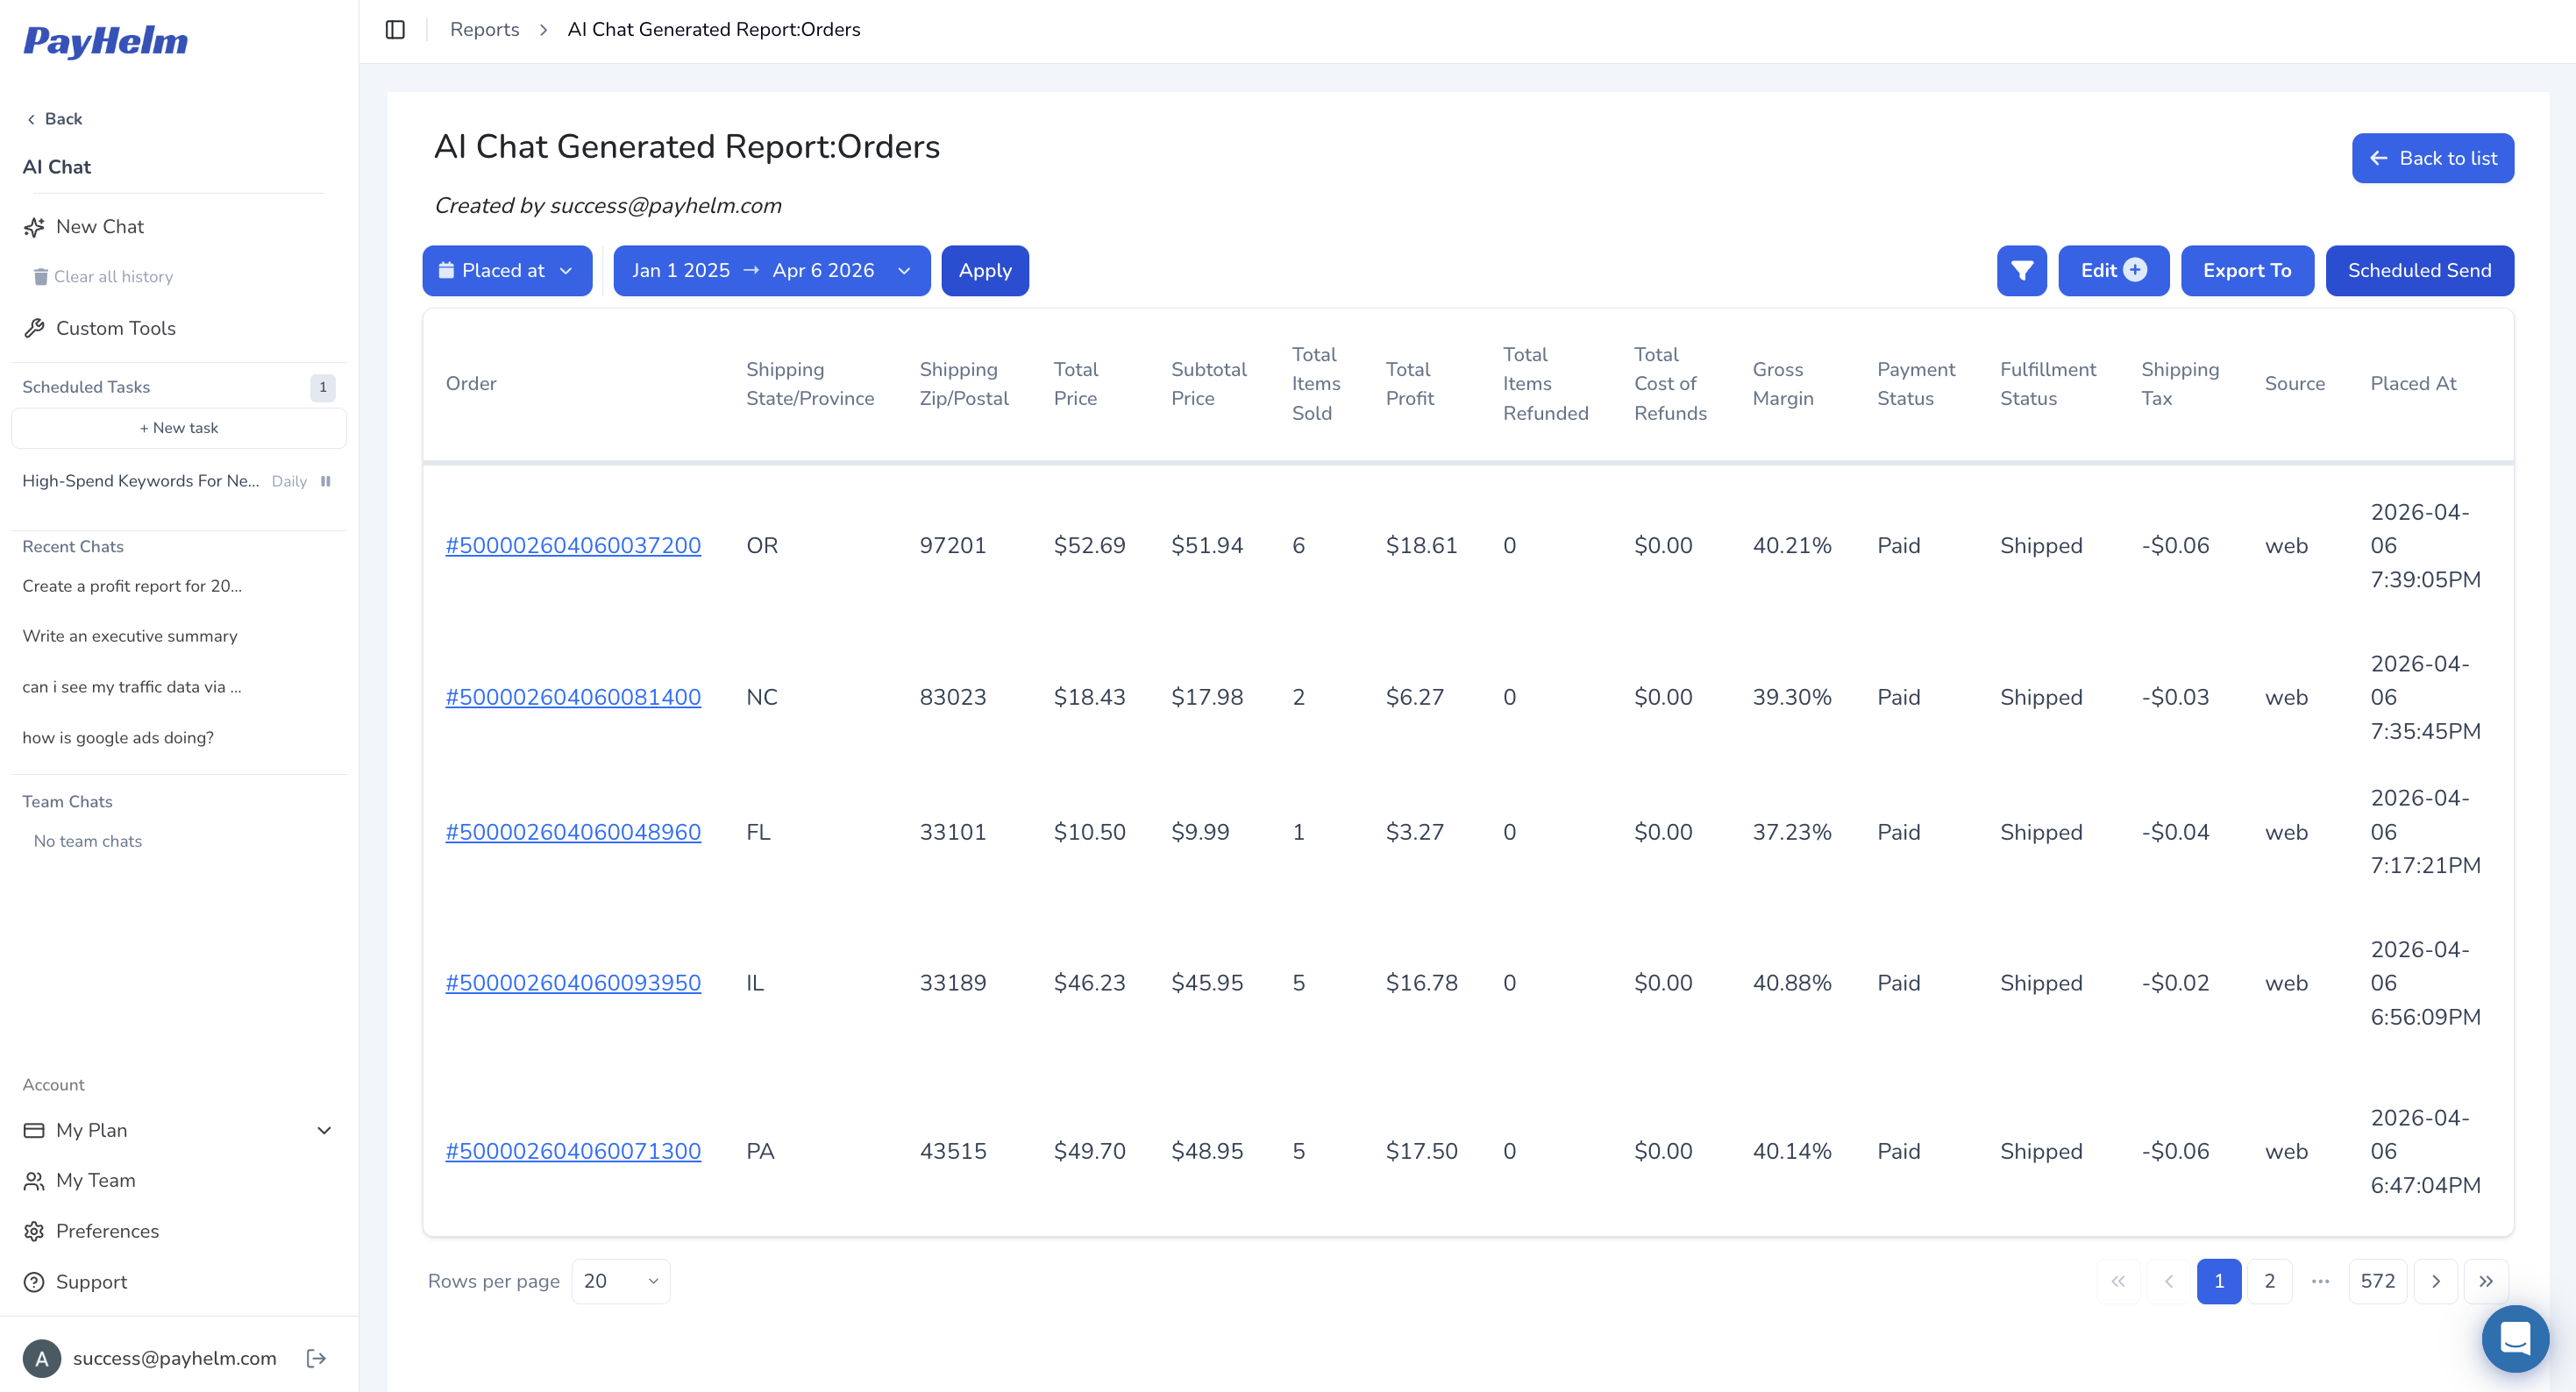
PayHelm can consolidate ecommerce data, explain material KPI changes, and create a recurring narrative. Ask, “What changed this quarter, why does it matter, and what risks need review?” Treat the output as a reviewable draft. Teams that distribute recurring leadership updates can pair it with PayHelm’s scheduled reports.
PayHelm can create the first narrative from connected data, while leadership retains review and approval. Ask for the important changes, their likely business impact, and open risks, then validate the output against the source metrics before distribution.
PayHelm is most useful when the question moves from a headline to a decision. Start with the broad result, ask a focused follow-up, and verify the supporting records before acting. That workflow keeps AI-generated analysis practical, transparent, and aligned with the operating team’s judgment. It gives the team a repeatable path from an observation to a responsible operational decision.