What Should an Ecommerce Operations Executive Summary Include?
Keep the focus on critical KPIs across sales, orders, fulfillment, inventory, customers, and profitability. Highlight meaningful changes from yesterday or a recent benchmark, then prioritize decisions over raw metrics.
Leadership usually needs a small set of metrics with clear comparison points, followed by exceptions and decisions. The format should make it easy to distinguish a temporary movement from a trend and a metric change from a change in business health.
Start by defining the decision this section needs to support. Record the metric definitions, comparison window, and owner before drawing a conclusion. That small amount of discipline makes the analysis easier to repeat and easier for another teammate to trust. It also gives the team a clear standard for deciding whether the next review shows improvement.
How AI Combines Data From Across Your Ecommerce Business
AI can bring together stores, marketplaces, advertising, fulfillment, and other connected systems. A consolidated view lets it explain relationships instead of reporting each dashboard in isolation.
Connected data is useful only when definitions and time zones line up. A reliable summary should identify the source and period behind each key result, especially when sales, ad spend, inventory, and fulfillment systems update on different schedules.
The comparison becomes more useful when the underlying data is complete and consistently labeled. Check for missing records, delayed updates, and changes in platform definitions before treating movement as a business signal. When the inputs are clear, an operator can explain the result without rebuilding the analysis manually. This check is especially important when several connected platforms refresh on different schedules.
How AI Identifies the Metrics, Changes, and Exceptions That Actually Matter
Compare current results with expected ranges and rank changes by size, unusualness, and business impact. Revenue rising while profit falls deserves a different response than a normal sales fluctuation.
Materiality depends on the business objective. A small margin change can matter more than a larger revenue movement, while a small inventory variance may be critical if it affects a product that supports a major campaign.
Break the result into the dimensions that can change the outcome, such as product, channel, location, customer group, or time period. A concentrated pattern usually points to a more actionable cause than a broad average. Keep the original total visible so the team can connect the detail back to business impact. The resulting view helps the right owner act without losing the context of the overall business.
Turning Raw Operational Data Into a Clear Executive Narrative
A strong briefing explains what happened, why it matters, and what needs attention. It adds context and likely contributors without burying leadership in an export of every available number.
A narrative should separate observed facts from interpretation and recommendation. That makes the briefing easier to review, reduces the chance of presenting a correlation as a cause, and gives leaders a clear question to resolve.
Interpret the finding as evidence to investigate, not as proof of a single cause. Compare it with a relevant control period and ask what changed in the workflow around the same time. This approach reduces false alarms while preserving the urgency of issues that affect customers or cash flow. It also makes the eventual recommendation easier to explain to stakeholders.
Automating Daily Executive Summaries Without Building Reports Manually
Scheduled summaries reduce dashboard checking, exports, and spreadsheet work. A consistent format also makes it easier to spot what changed from one day to the next.
Automation works best with a stable template and a review checkpoint. Keep the recurring structure consistent, but allow the important exception and recommended action to change with the data rather than forcing every day into the same story.
Turn the insight into a small next step with a named owner and a date for review. The team can test a process change, adjust a planning assumption, or request better source data. Measuring the same section again shows whether the action solved the problem or only moved it elsewhere. A short feedback loop is more useful than a one-time report that is never revisited.
Automating Daily Executive Briefings With PayHelm
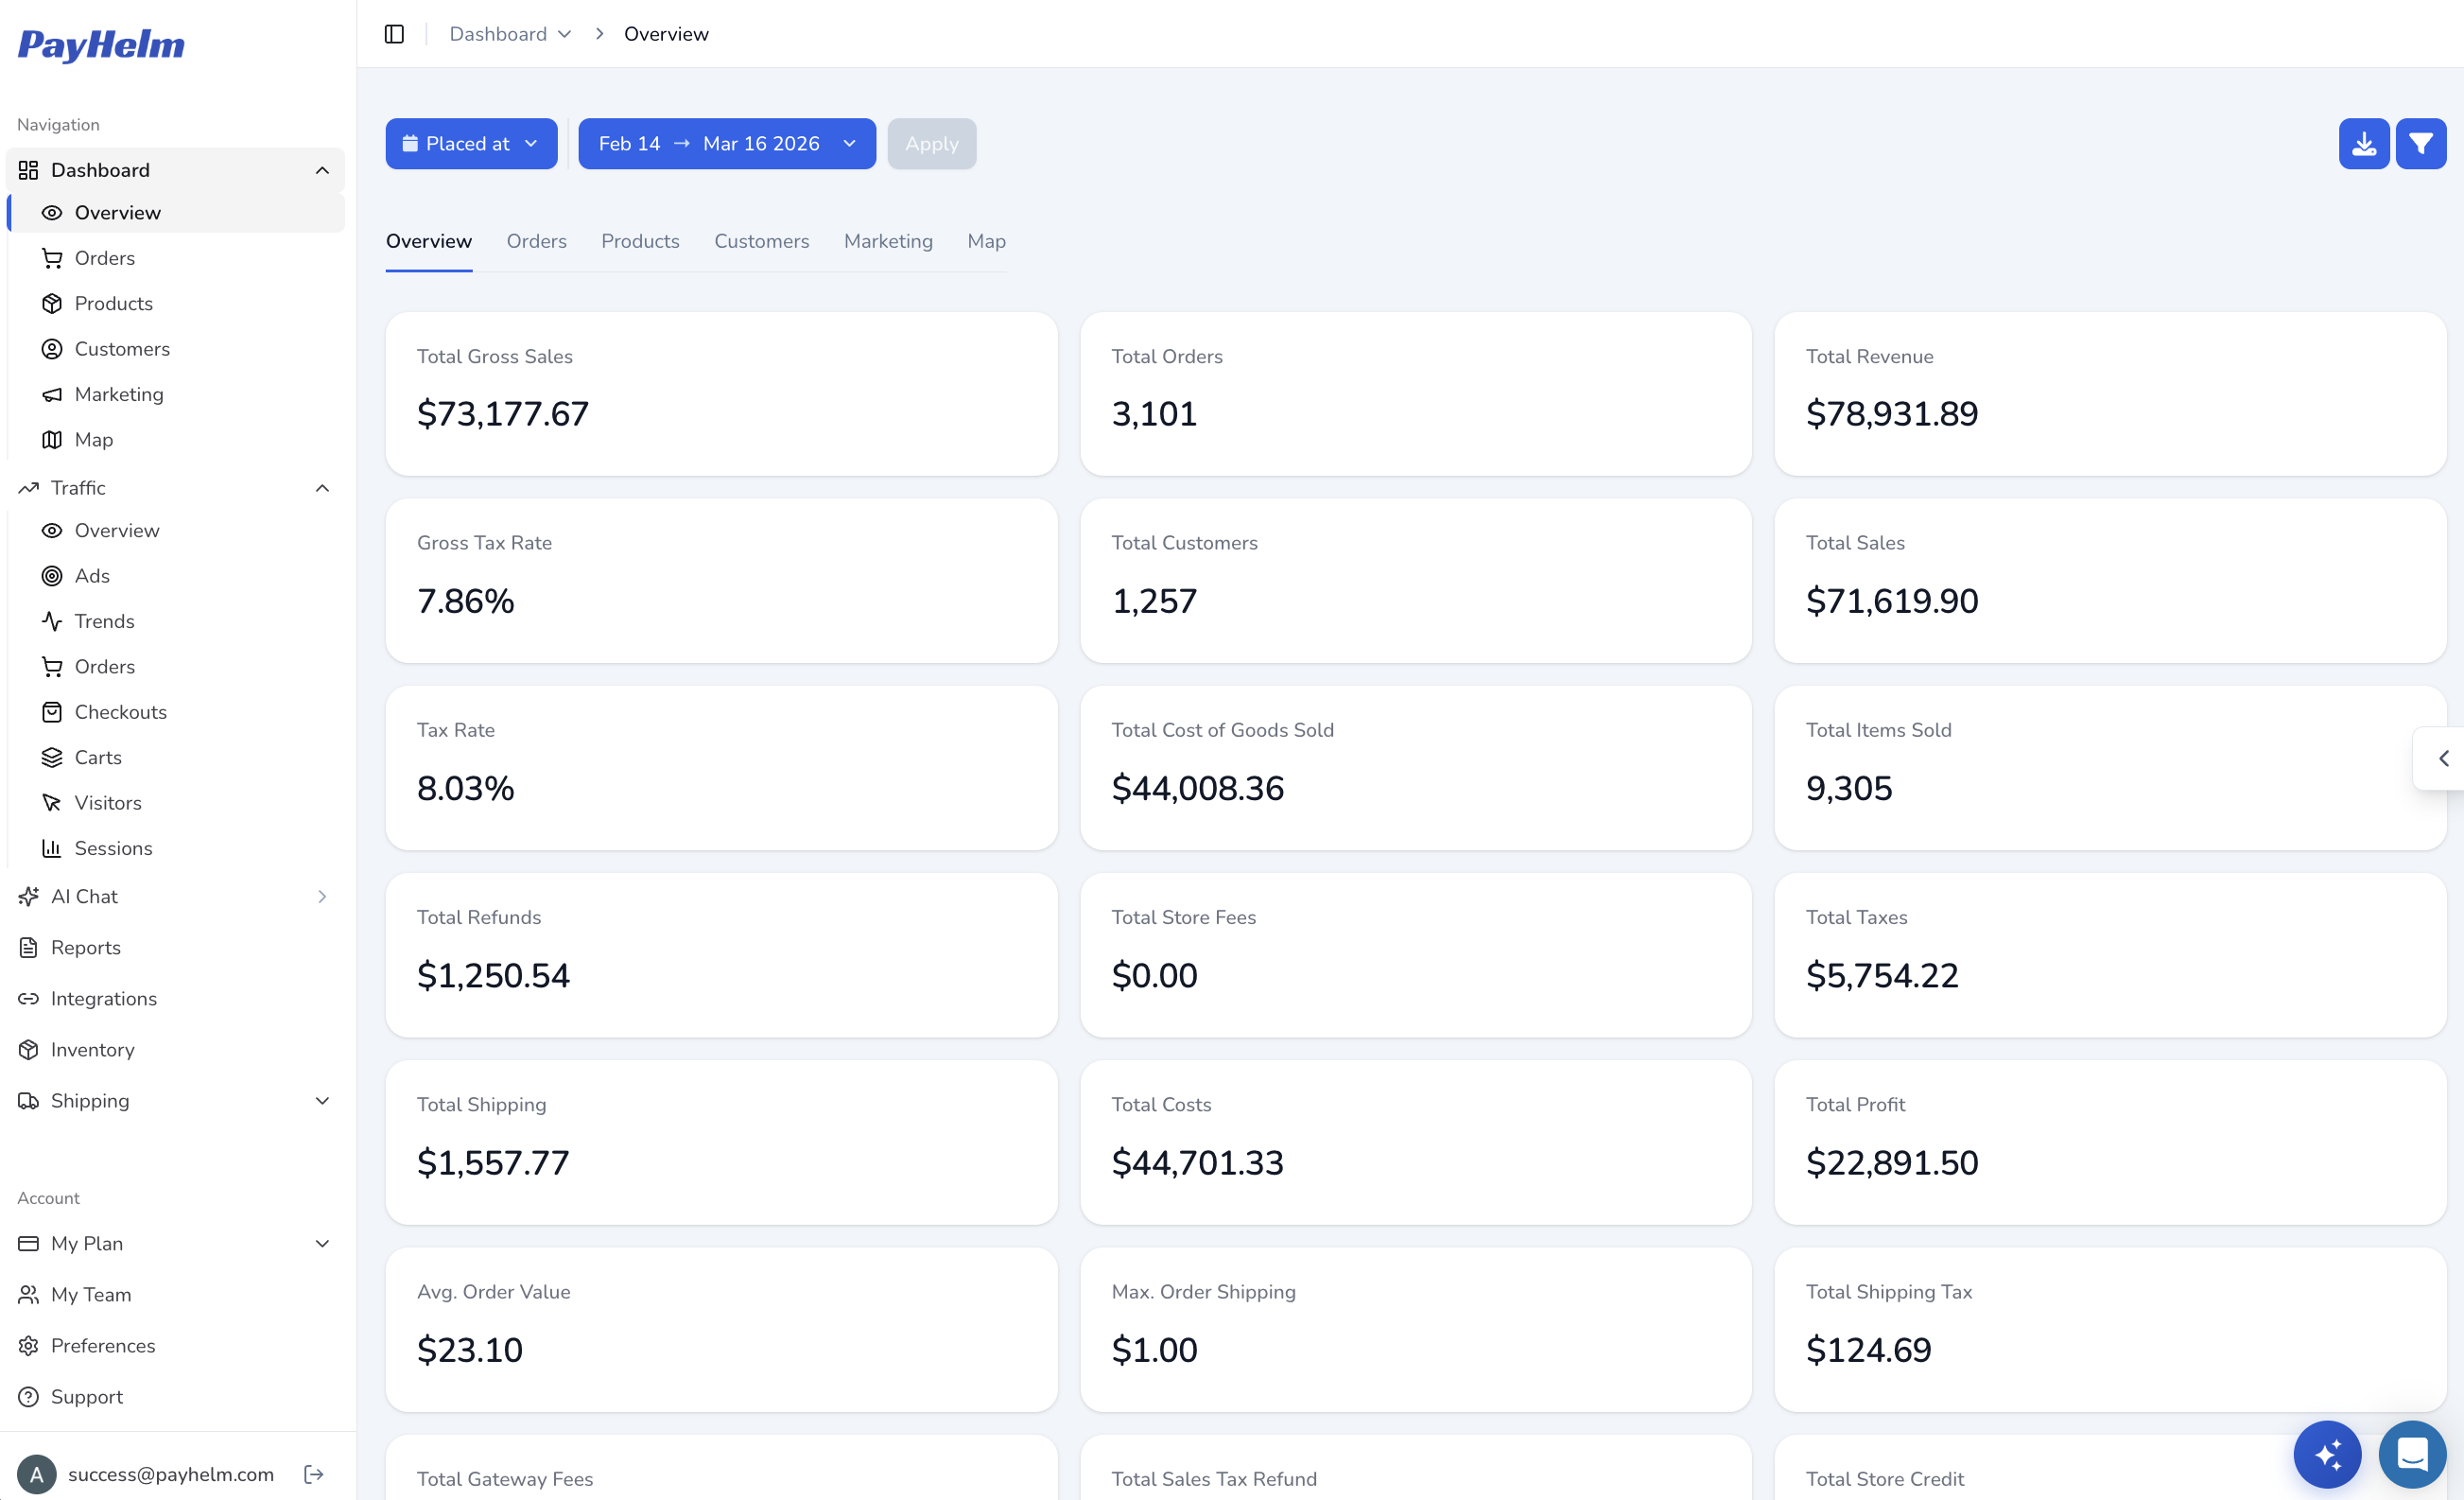
PayHelm can analyze connected ecommerce data in plain English. Ask, “Summarize today’s revenue, profit, orders, fulfillment, inventory, and marketing, and tell me what needs attention.” Schedule that briefing for a repeatable workflow. The daily snapshot feature is another useful starting point for a consistent operating review.
Follow the first briefing with targeted questions about the largest change or risk. PayHelm can provide the broad view first and then help the team investigate the products, channels, or operational events behind the headline.
PayHelm is most useful when the question moves from a headline to a decision. Start with the broad result, ask a focused follow-up, and verify the supporting records before acting. That workflow keeps AI-generated analysis practical, transparent, and aligned with the operating team’s judgment. It gives the team a repeatable path from an observation to a responsible operational decision.