What Factors Can Signal an Increased Risk of a Refund?
Useful signals include historical refund behavior, product-level refund rates, order characteristics, and purchase patterns. No single signal proves a customer will request a refund; it only indicates elevated risk.
Signals should be evaluated at the product and experience level as well as the customer level. A high refund rate may indicate unclear copy, sizing problems, damage in transit, or an expectation gap that better communication could reduce.
Start by defining the decision this section needs to support. Record the metric definitions, comparison window, and owner before drawing a conclusion. That small amount of discipline makes the analysis easier to repeat and easier for another teammate to trust. It also gives the team a clear standard for deciding whether the next review shows improvement.
How AI Can Analyze Historical Order and Refund Patterns
AI can compare refunded orders with retained orders and find combinations that appear more often among refunds. Larger histories make subtle product and order patterns easier to see.
Compare like-for-like orders and define the outcome consistently before looking for relationships. The analysis should also show sample size and time period, because a high percentage from a handful of orders is less reliable than a moderate pattern across a large history.
The comparison becomes more useful when the underlying data is complete and consistently labeled. Check for missing records, delayed updates, and changes in platform definitions before treating movement as a business signal. When the inputs are clear, an operator can explain the result without rebuilding the analysis manually. This check is especially important when several connected platforms refresh on different schedules.
Identifying Products, Order Behaviors, and Customer Segments Associated With Refunds
Segment analysis may reveal high-refund products, first purchases, large orders, discounts, or other shared characteristics. That points to broader product or service problems, not just individual customers.
Segment results are most useful when they lead to a testable improvement. Update a product description, packaging process, or support message, then monitor whether refund reasons and rates change for the affected group.
Break the result into the dimensions that can change the outcome, such as product, channel, location, customer group, or time period. A concentrated pattern usually points to a more actionable cause than a broad average. Keep the original total visible so the team can connect the detail back to business impact. The resulting view helps the right owner act without losing the context of the overall business.
How to Use Refund-Risk Insights Without Overgeneralizing Customer Behavior
Risk scores are probabilities, not verdicts. Avoid punitive treatment based only on AI output; use the signal to offer help, investigate an order, or improve customer communication.
Use risk analysis to offer better service, not to deny a fair resolution. Keep human review in the process, avoid sensitive inferences that are not needed for the business decision, and communicate with customers based on their actual order context.
Interpret the finding as evidence to investigate, not as proof of a single cause. Compare it with a relevant control period and ask what changed in the workflow around the same time. This approach reduces false alarms while preserving the urgency of issues that affect customers or cash flow. It also makes the eventual recommendation easier to explain to stakeholders.
Turning Refund Analysis Into Better Customer and Product Decisions
Use findings to improve descriptions, sizing guidance, fulfillment quality, or support. Track refund rates after each change to learn whether the underlying experience is improving.
Refunds are often a lagging indicator of an earlier experience problem. Pair refund patterns with reviews, support contacts, fulfillment timing, and product information so the team can address the cause instead of only managing the outcome.
Turn the insight into a small next step with a named owner and a date for review. The team can test a process change, adjust a planning assumption, or request better source data. Measuring the same section again shows whether the action solved the problem or only moved it elsewhere. A short feedback loop is more useful than a one-time report that is never revisited.
Using PayHelm to Analyze Refund Risk and Patterns
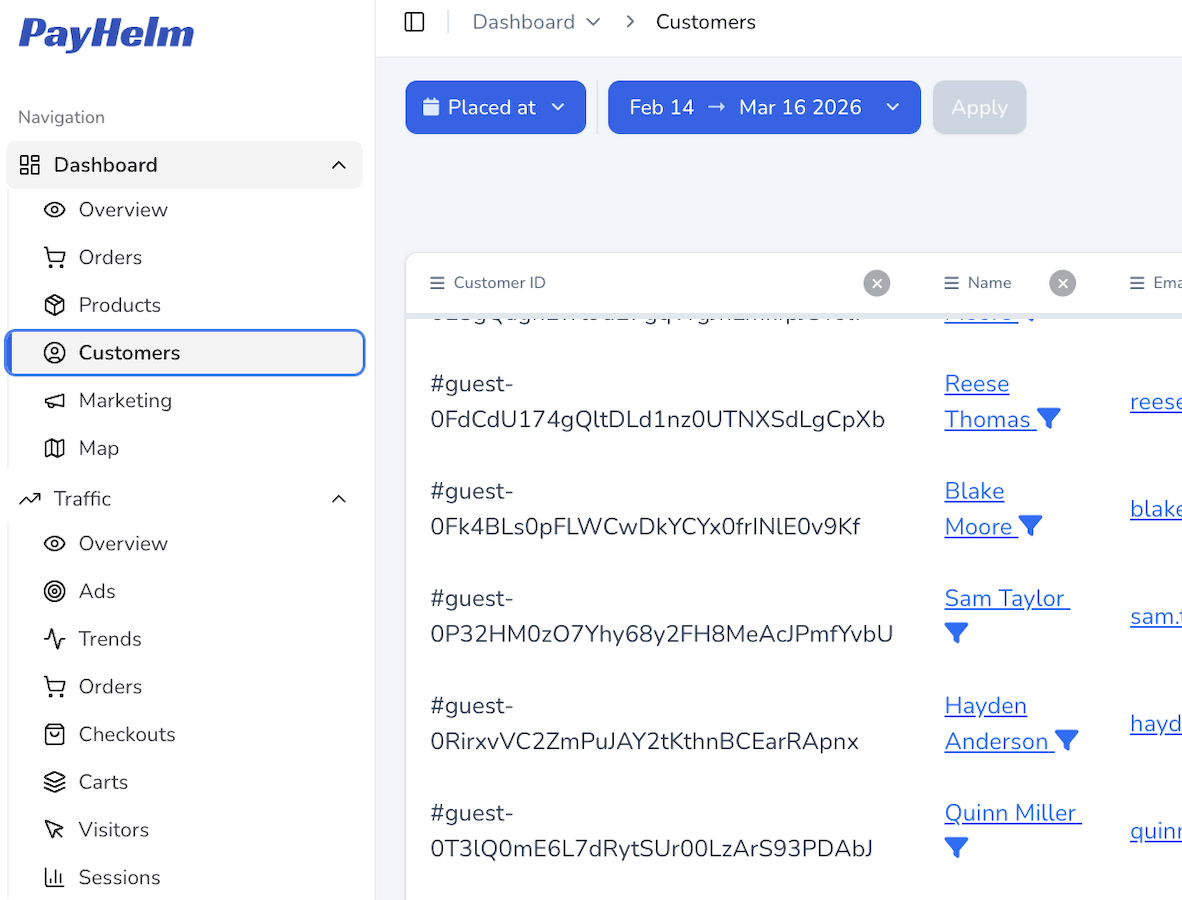
PayHelm can connect customer, order, product, and refund history for investigation. Ask, “Which products or order characteristics are associated with refunds?” Use the answer to improve the experience, not label people. The related customer analytics tools can add retention and customer-value context to the review.
Ask PayHelm to compare refund patterns by product, order type, and period, then request the limitations of the analysis. That keeps the output useful for improving the experience while avoiding unsupported conclusions about individual customers.
PayHelm is most useful when the question moves from a headline to a decision. Start with the broad result, ask a focused follow-up, and verify the supporting records before acting. That workflow keeps AI-generated analysis practical, transparent, and aligned with the operating team’s judgment. It gives the team a repeatable path from an observation to a responsible operational decision.