What Makes Product Demand Unpredictable?
Unpredictable demand fluctuates sharply rather than staying consistently high or low. Promotions, launches, trends, seasonality, and outside events can make purchasing and inventory planning difficult.
Volatility can come from genuine customer interest, weak data, or a product lifecycle transition. Separating those causes helps avoid over-ordering a temporary trend or under-ordering a product whose demand is becoming more consistent.
Start by defining the decision this section needs to support. Record the metric definitions, comparison window, and owner before drawing a conclusion. That small amount of discipline makes the analysis easier to repeat and easier for another teammate to trust. It also gives the team a clear standard for deciding whether the next review shows improvement.
How to Measure Demand Variability Across Products and SKUs
Compare daily or weekly sales using average demand, range, variance, or coefficient of variation. Relative measures matter: ten extra units mean something different for a product that sells ten versus one thousand.
Use the same time interval and minimum history when comparing products, and flag sparse data separately. A variability score should be paired with sales volume so an occasional low-volume purchase does not receive the same operational weight as a major SKU.
The comparison becomes more useful when the underlying data is complete and consistently labeled. Check for missing records, delayed updates, and changes in platform definitions before treating movement as a business signal. When the inputs are clear, an operator can explain the result without rebuilding the analysis manually. This check is especially important when several connected platforms refresh on different schedules.
How AI Identifies Products With Unusual or Volatile Sales Patterns
AI can evaluate an entire catalog, rank inconsistent SKUs, and use history to avoid confusing a naturally volatile product with a genuinely new anomaly.
Ranking is a starting point rather than a final diagnosis. Review the events around the most volatile periods, including promotions, stockouts, pricing changes, and channel launches, before changing the reorder policy.
Break the result into the dimensions that can change the outcome, such as product, channel, location, customer group, or time period. A concentrated pattern usually points to a more actionable cause than a broad average. Keep the original total visible so the team can connect the detail back to business impact. The resulting view helps the right owner act without losing the context of the overall business.
Separating Seasonal Demand From Genuine Demand Volatility
Predictable holiday peaks are not necessarily volatility. Comparing equivalent historical periods helps AI distinguish an expected seasonal pattern from demand that moves outside its normal range.
Seasonality is easier to recognize when equivalent periods are compared across more than one year. If the history is limited, label the result as uncertain and combine the model output with merchandising knowledge instead of treating the pattern as established.
Interpret the finding as evidence to investigate, not as proof of a single cause. Compare it with a relevant control period and ask what changed in the workflow around the same time. This approach reduces false alarms while preserving the urgency of issues that affect customers or cash flow. It also makes the eventual recommendation easier to explain to stakeholders.
Using Demand Variability to Make Better Inventory Decisions
Predictable and unpredictable products may need different safety-stock buffers and reorder timing. The goal is to balance stockout risk against the cost of carrying inventory that may not sell.
Safety stock should reflect both uncertainty and the cost of being wrong. High variability with a long supplier lead time may justify a larger buffer, while expensive or perishable inventory may call for a smaller commitment and more frequent review.
Turn the insight into a small next step with a named owner and a date for review. The team can test a process change, adjust a planning assumption, or request better source data. Measuring the same section again shows whether the action solved the problem or only moved it elsewhere. A short feedback loop is more useful than a one-time report that is never revisited.
Analyzing Product Demand With PayHelm AI
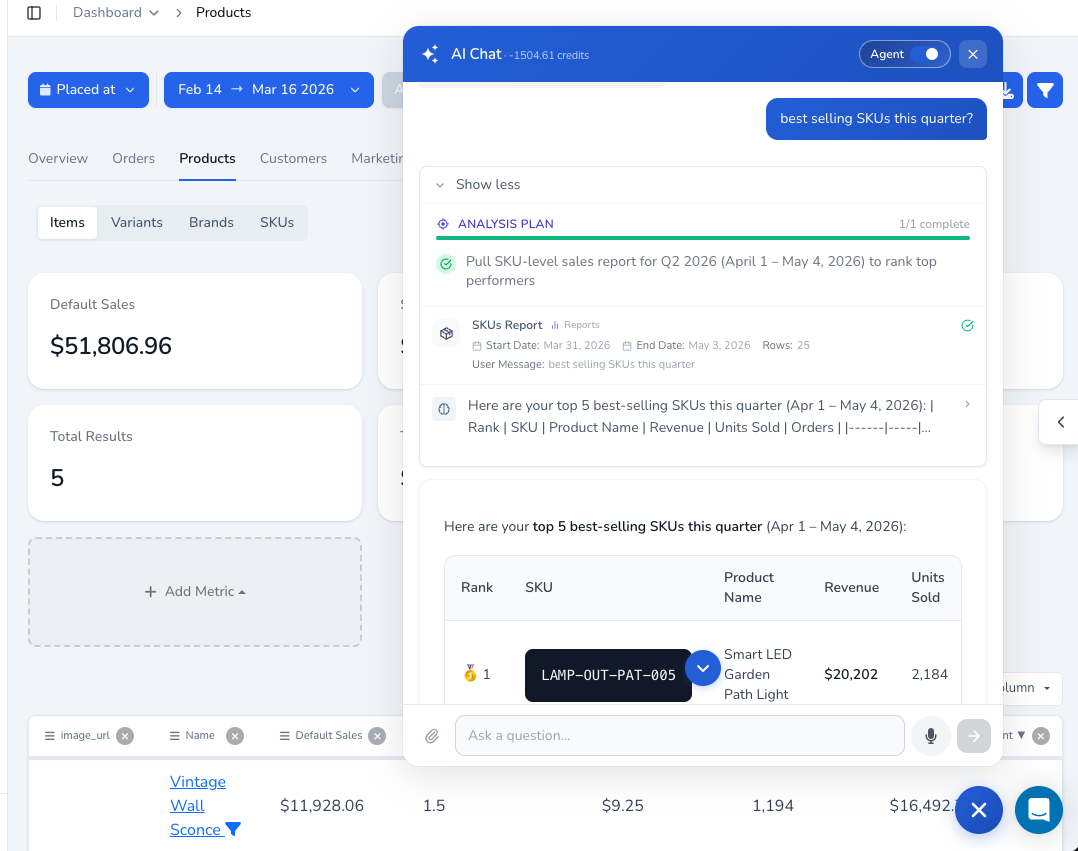
PayHelm can compare historical SKU patterns across a catalog. Ask, “Which of my top 100 products had the most unpredictable weekly demand over six months?” Use the result to focus inventory planning where it matters. Product teams can continue that work in PayHelm’s product analytics, where SKU performance can be evaluated in context.
PayHelm can help narrow a catalog-wide question into an actionable set of SKUs. Ask which products are volatile, what events explain the changes, and how the result should affect reorder points before making an inventory adjustment.
PayHelm is most useful when the question moves from a headline to a decision. Start with the broad result, ask a focused follow-up, and verify the supporting records before acting. That workflow keeps AI-generated analysis practical, transparent, and aligned with the operating team’s judgment. It gives the team a repeatable path from an observation to a responsible operational decision.