Analyzing Revenue by Product Categories and Coupon Codes
In this article
Analyzing Revenue by Product Categories and Coupon Codes
PayHelm provides powerful filtering and reporting capabilities to help you analyze revenue performance across different product categories and track the effectiveness of your coupon codes and promotional campaigns.
Accessing Category and Coupon Code Analysis
Step 1: Navigate to Your Dashboard
- Log into your PayHelm account
- Click on Dashboard from the main navigation menu
- Wait for your data to fully load (this typically takes 1-2 minutes for recent data to appear)
- Ensure you have selected the appropriate date range for your analysis
Step 2: Using Category Filters
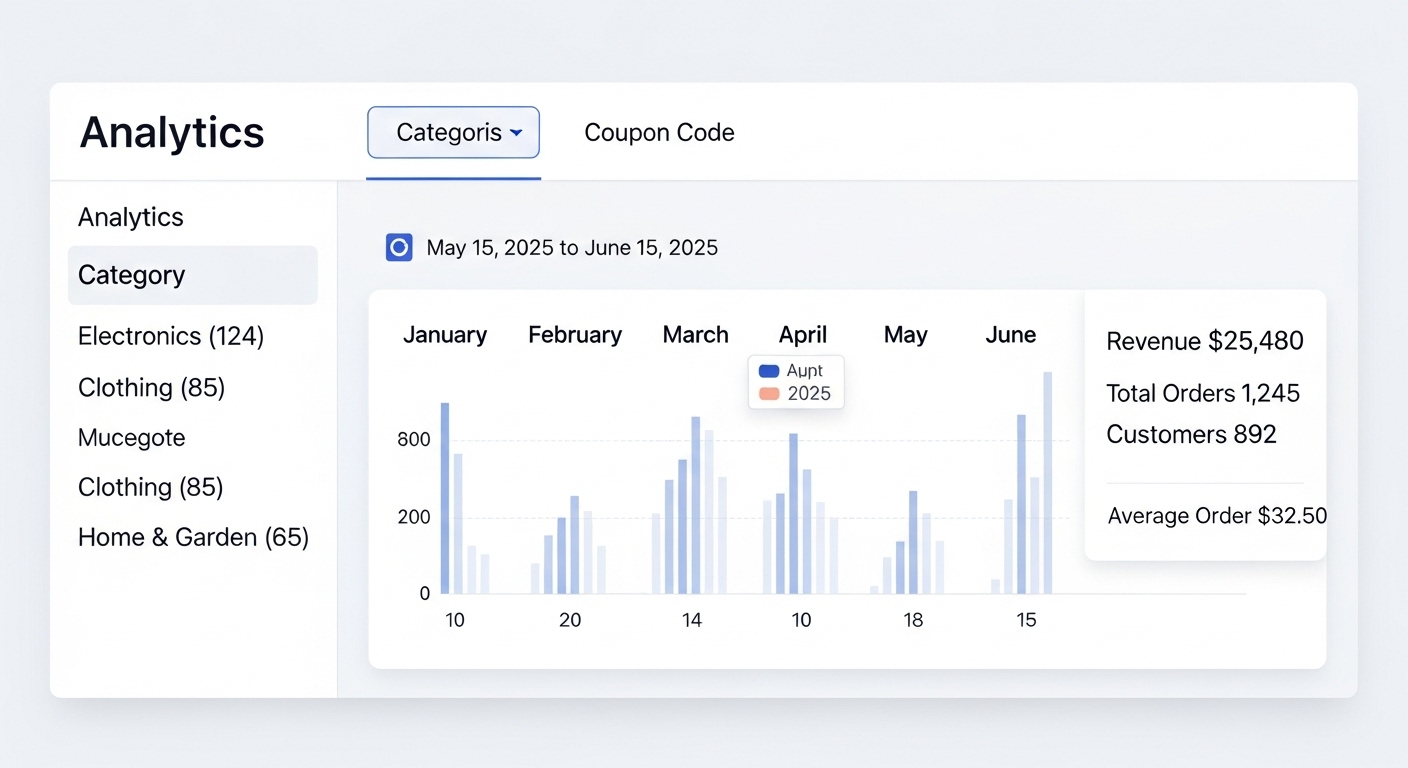
The PayHelm dashboard showing category filtering options and coupon code analysis tools.
Accessing Category Filters:
- Look for the Filters section in your dashboard (typically on the left side)
- Locate the Category filter dropdown
- Click on the Category filter to expand your available product categories
- You'll see your categories listed with numbers in parentheses showing the count of products or orders in each category
Applying Category Filters:
- Select one or more categories you want to analyze
- The numbers in parentheses indicate the volume of data in each category
- Click Apply or the filter will automatically update your dashboard
- Your revenue metrics will now reflect data only for the selected categories
Step 3: Analyzing Coupon Code Performance
Accessing Coupon Code Filters:
- In the same Filters section, look for the Coupon Code or Promo Code filter
- Click on this filter to see available coupon codes
- Select specific coupon codes you want to analyze
- Apply the filter to view revenue generated from those specific codes
Combining Filters:
- You can use both category and coupon code filters simultaneously
- This allows you to see which categories perform best with specific promotional campaigns
- Combine with date range filters for seasonal analysis
Building Custom Reports
Using the Reports Tab
PayHelm's Reports functionality provides advanced analysis capabilities beyond basic filtering:
Accessing Reports:
- Click on the Reports tab at the top of your dashboard
- Select Create New Report or choose from existing report templates
- Choose the metrics you want to analyze (revenue, orders, conversion rates, etc.)
Creating Category and Coupon Code Reports:
- Select Data Sources: Choose the categories and coupon codes you want to include
- Choose Metrics: Select relevant metrics such as:
- Total revenue by category
- Average order value per category
- Coupon code redemption rates
- Revenue attribution by coupon code
- Visualization Options: Display your data as:
- Tables for detailed numerical analysis
- Charts for visual trend identification
- Graphs for performance comparisons
Report Customization Options
- Time Periods: Compare performance across different date ranges
- Segmentation: Break down data by category, coupon code, customer segment, or geographic location
- Export Options: Download reports for external analysis or sharing with stakeholders
Key Metrics to Analyze
Category Performance Metrics
Revenue Analysis:
- Total revenue by product category
- Average order value per category
- Revenue trends over time for each category
- Category mix as percentage of total revenue
Volume Analysis:
- Number of orders per category
- Units sold by category
- Conversion rates by product type
- Customer acquisition by category
Coupon Code Effectiveness Metrics
Usage Analytics:
- Total redemptions per coupon code
- Revenue generated by each promotional campaign
- Average discount amount applied
- Customer acquisition through promotional codes
Performance Comparison:
- Revenue lift from promotional periods vs. non-promotional periods
- Customer lifetime value for coupon users vs. regular customers
- Repeat purchase rates for customers who used coupons
Data Timing and Updates
Understanding Data Refresh
Initial Data Loading:
- New data typically appears within 1-2 minutes of being processed
- Historical data is available immediately upon logging in
- Real-time updates depend on your ecommerce platform's sync frequency
Best Practices for Accurate Analysis:
- Allow sufficient time for data to fully load before applying filters
- Check the last sync time indicator to ensure you're viewing current data
- Refresh your browser if data appears to be missing or outdated
Advanced Analysis Techniques
Comparative Analysis
Period-over-Period Comparison:
- Set up two date ranges to compare (e.g., this month vs. last month)
- Apply the same category and coupon filters to both periods
- Analyze changes in performance metrics
- Identify trends and seasonal patterns
Category Cross-Analysis:
- Compare performance across different product categories
- Identify your highest and lowest performing categories
- Analyze the impact of promotions on different category types
- Optimize inventory and marketing strategies based on category performance
Coupon Code Strategy Optimization
Campaign Performance Review:
- Track which coupon codes drive the most revenue
- Analyze customer behavior changes during promotional periods
- Identify optimal discount levels for different product categories
- Monitor coupon code abuse or unusual usage patterns
ROI Calculation:
- Calculate the return on investment for promotional campaigns
- Compare revenue generated vs. discount amounts given
- Track customer acquisition costs through promotional channels
- Measure long-term customer value from coupon-acquired customers
Troubleshooting Common Issues
Missing Category Data
If categories don't appear in filters:
- Check Data Sync: Ensure your ecommerce platform is properly connected
- Verify Category Setup: Confirm categories are properly configured in your store
- Data Processing Time: Allow 24-48 hours for new categories to appear in PayHelm
- Platform Integration: Some platforms may require additional category mapping
Coupon Code Tracking Issues
If coupon codes aren't showing:
- Platform Configuration: Verify coupon codes are set up correctly in your ecommerce platform
- Sync Settings: Check that promotional data is being synced to PayHelm
- Code Format: Ensure coupon codes match exactly between your platform and PayHelm
- Date Range: Verify you're looking at the correct time period when codes were active
Data Accuracy Considerations
Ensuring Reliable Analysis:
- Multiple Data Sources: Cross-reference PayHelm data with your platform's native reporting
- Filter Combination: Be careful when combining multiple filters as this may reduce data sets significantly
- Time Zone Settings: Ensure your PayHelm account uses the same time zone as your business operations
- Currency Consistency: Verify all revenue figures are displayed in your preferred currency
Export and Sharing Options
Data Export Capabilities
Export Formats:
- CSV files for spreadsheet analysis
- PDF reports for presentations
- Direct integration with Google Sheets
- API access for custom integrations
Scheduled Reports:
- Set up automated reports to be delivered weekly or monthly
- Schedule category performance summaries
- Automate coupon code effectiveness reports
- Create executive dashboards with key metrics
Integration with Business Tools
CRM Integration:
- Connect category and coupon data with customer relationship management systems
- Track promotional campaign effectiveness in your sales pipeline
- Segment customers based on category preferences and coupon usage
Marketing Platform Integration:
- Use category performance data to optimize advertising spend
- Create targeted campaigns based on high-performing product categories
- Develop coupon strategies based on historical redemption data
Need Additional Help?
If you need assistance setting up specific category filters, creating custom coupon code reports, or have questions about integrating this data with your marketing strategies, our support team can provide personalized guidance for your business needs.
Related Articles
Custom Metric Builder
Build any KPI you need using PayHelm's Custom Metric Builder — combine revenue, orders, spend, and more into calculated metrics you can use across every report.
Understanding Dual Commission Reports: Commission vs Sales Tracking
Learn why PayHelm uses two separate commission reports and how each serves a distinct purpose in tracking commission payments versus sales performance for comprehensive sales team management.
Calculate Average Inventory Turns and Time on Shelf
Measure how quickly your inventory sells with inventory turnover metrics and time on shelf analysis to optimize purchasing and identify slow-moving products.
Automate with PayHelm AI
Let an AI agent handle these tasks for you — automatically, on a schedule.
Audit UTM Params for Missing Attribution
Stop losing attribution data to untagged campaigns and broken UTM parameters.
Audit Site Search Queries for Missing Products or Bad Results
Your site search is telling you what to sell and what to fix — are you listening?
Flag Campaigns with Spend Spikes or Pacing Issues
Catch budget anomalies the same day they start — not when your monthly statement arrives.
From the PayHelm Blog
Insights and guides to help you grow your ecommerce business.
Introducing Custom Columns in PayHelm
Master PayHelm's custom columns feature to create unique metrics, incorporate custom calculations, and build tailored reports that align with your business objectives.
Why Repeat Customers Are the Lifeblood of Your Ecommerce Business
Smart retailers value repeat buyers above all others. Learn why the most profitable customers are those you already have, and how to keep them coming back.
Prepare Amazon Analytics for $1T Agentic Commerce
By 2030, agentic commerce powered by autonomous AI agents could generate up to $1 trillion in orchestrated revenue within the US B2C retail market alone. Learn how to upgrade your Amazon analytics infrastructure to compete effectively in the agent-driven marketplace.