How to Create a Traffic Report
Duration: 0:57 min
In this article
Overview
Traffic reports in PayHelm help you understand where your website visitors come from and how they interact with your store. You can track sessions, visitors, marketing campaigns, and conversions from advertising platforms like Google Ads, Facebook Ads, and more.
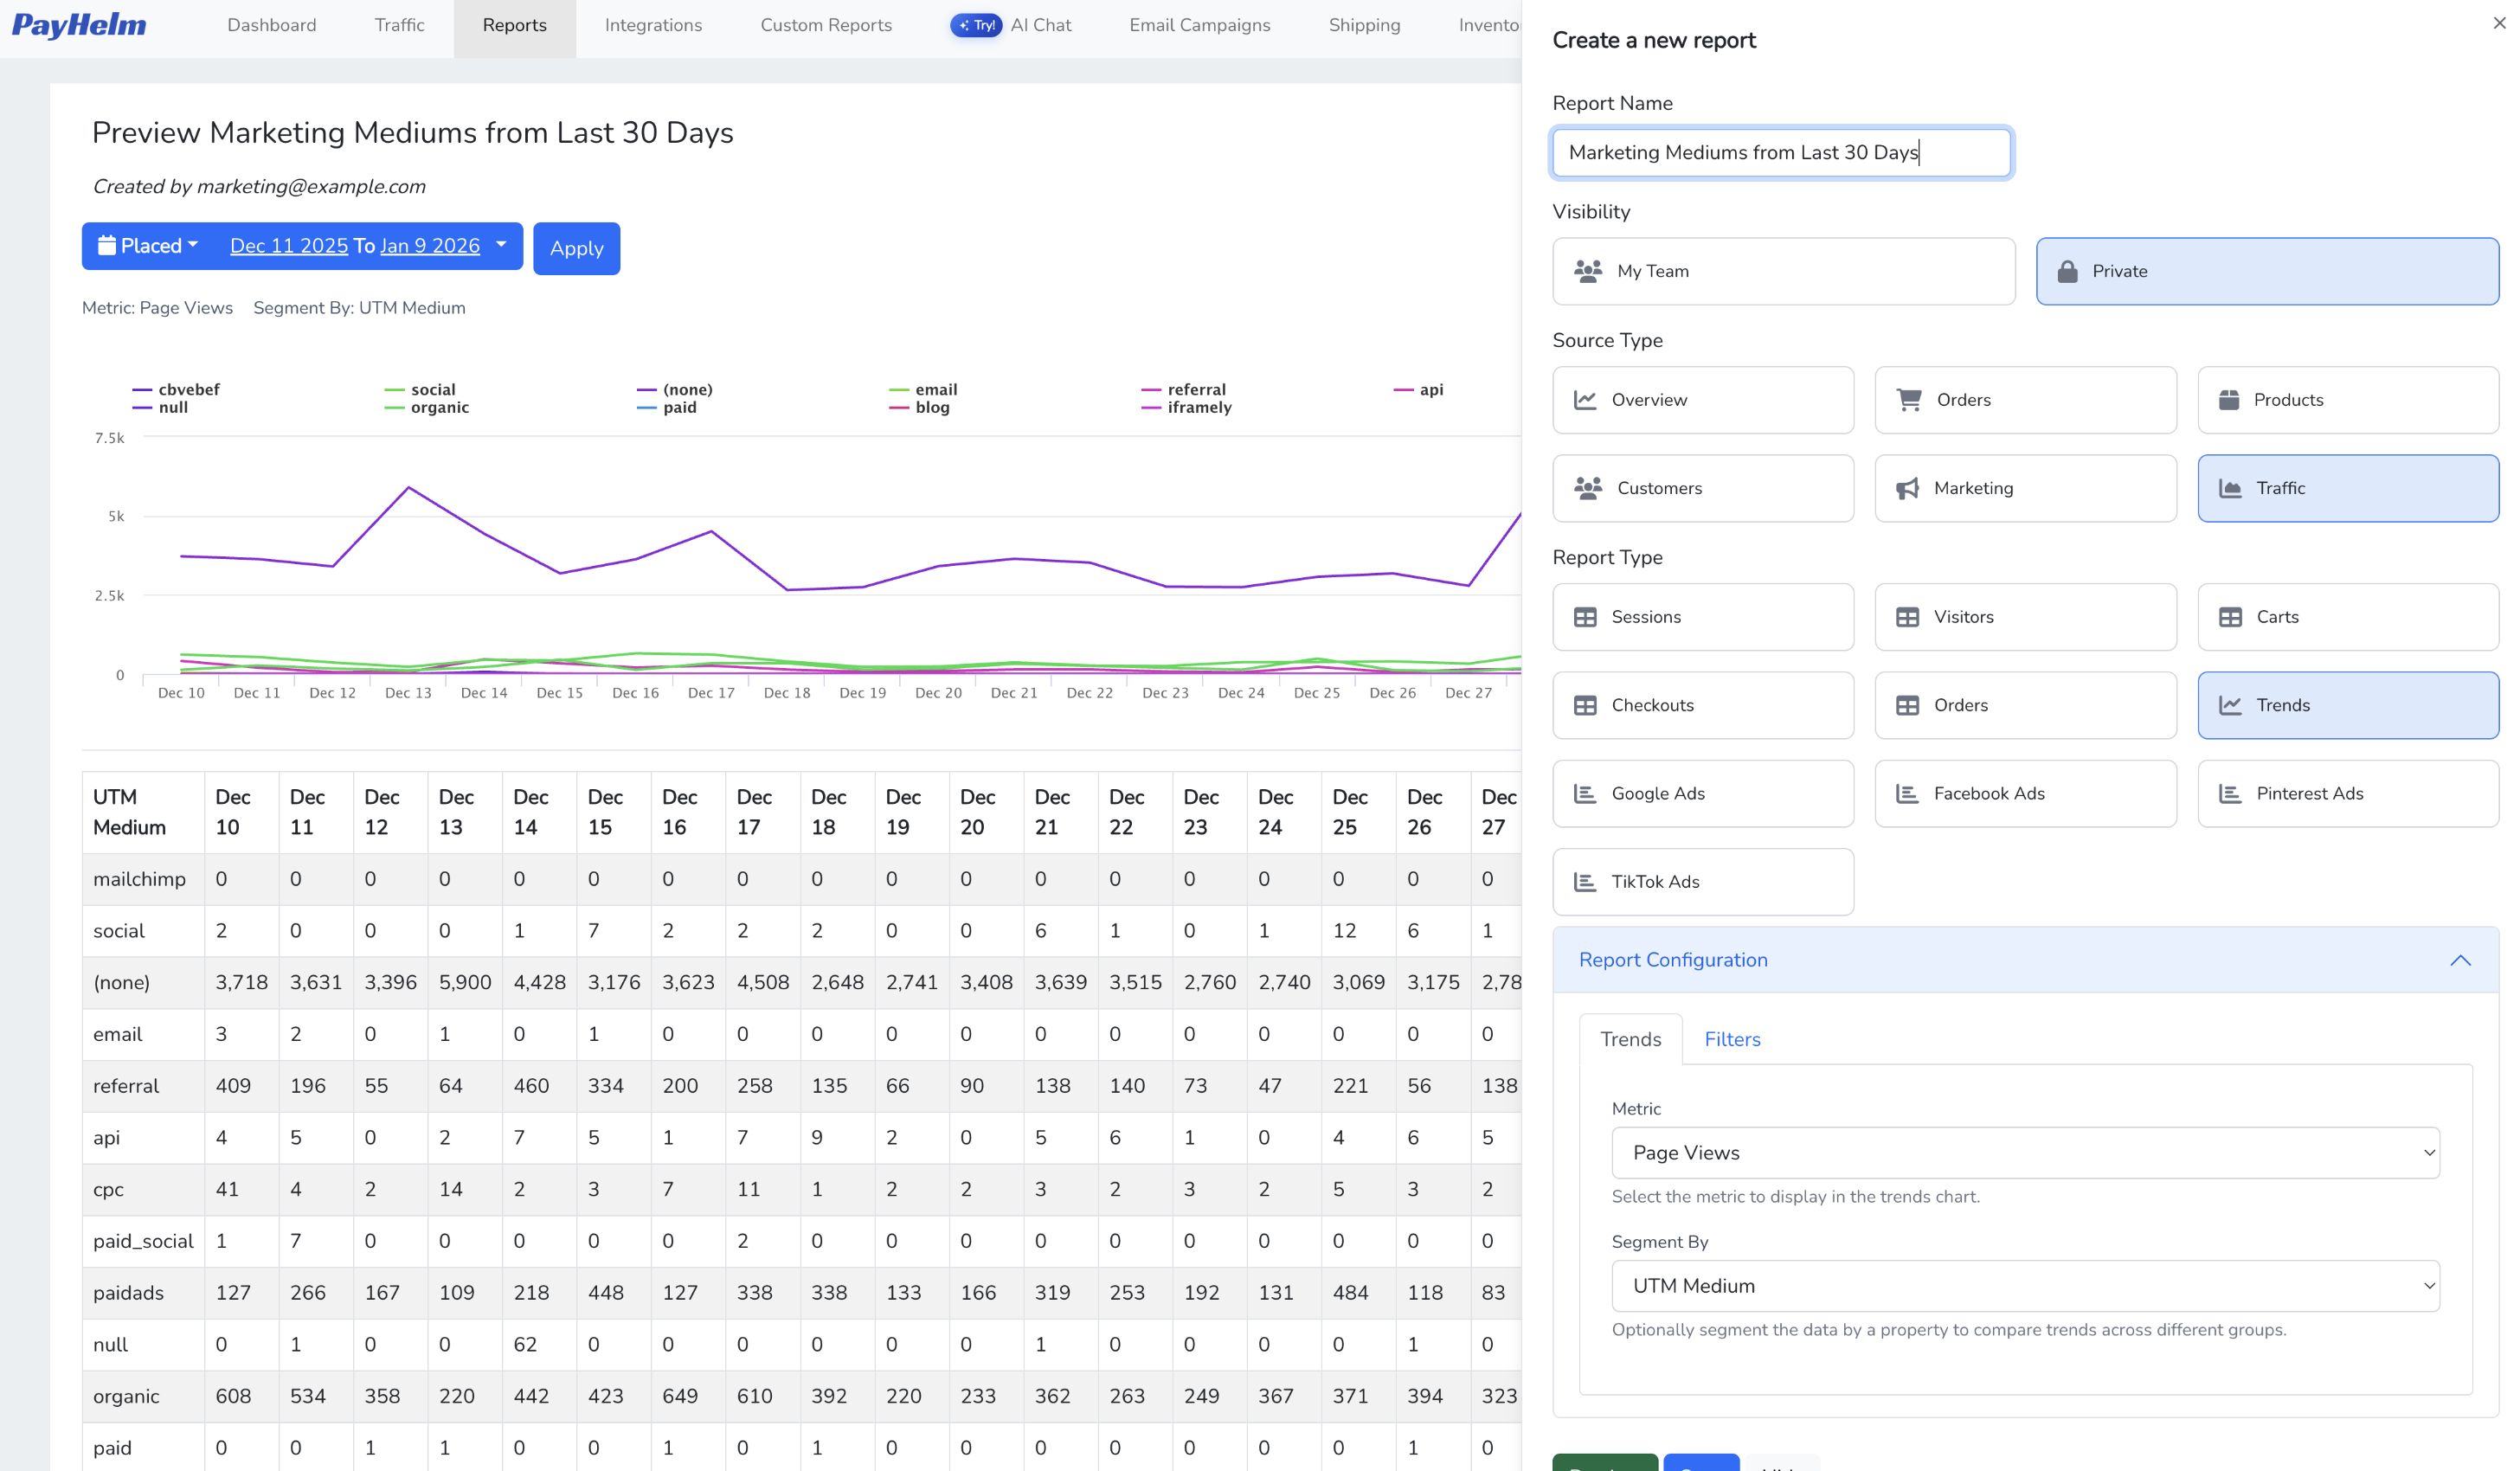
Step 1: Open the Reports Page
Navigate to Reports in the top navigation bar. You'll see a list of all your existing reports.
Step 2: Click Create New Report
Click the blue Create New Report button in the top right corner. This opens the report creation panel.
Step 3: Name Your Report
Enter a descriptive name for your report in the Report Name field. For example:
- "Marketing Mediums from Last 30 Days"
- "Google Ads Campaign Performance"
- "Traffic Sources by UTM Medium"
Step 4: Set Visibility
Choose who can see this report:
- My Team - All team members can view and use this report
- Private - Only you can see this report
Step 5: Select Traffic as Source Type
Under Source Type, click on Traffic. This tells PayHelm you want to analyze visitor and session data rather than orders or products.
Step 6: Choose Your Report Type
After selecting Traffic, you'll see several report type options:
Session & Visitor Reports
- Sessions - Track individual browsing sessions
- Visitors - Analyze unique visitors to your store
- Carts - See visitors who added items to cart
- Checkouts - Track visitors who started checkout
- Orders - View visitors who completed orders
- Trends - Analyze traffic patterns over time
Advertising Platform Reports
- Google Ads - See performance of your Google advertising
- Facebook Ads - Track Meta/Facebook ad campaigns
- Pinterest Ads - Analyze Pinterest advertising
- TikTok Ads - View TikTok campaign performance
Click the report type that matches what you want to analyze.
Step 7: Configure Report Columns
Expand the Report Configuration section to customize your report:
- Report Column tab - Choose which data columns appear in your report
- Filters tab - Add conditions to narrow down your data
Common Traffic Columns
- Page Views
- Sessions
- UTM Source
- UTM Medium
- UTM Campaign
- Conversion Rate
- Revenue
Setting Up Segments
Use the Segment By dropdown to group your data. For example, selecting "UTM Medium" will show traffic broken down by marketing channel (organic, paid, social, email, etc.).
Step 8: Preview Your Report
Click the Preview button to see how your report looks with real data. The preview shows:
- A chart visualization of your data
- A detailed data table below the chart
Step 9: Save Your Report
Once you're happy with the preview, click Save to save your report. It will appear in your Reports list and can be accessed anytime.
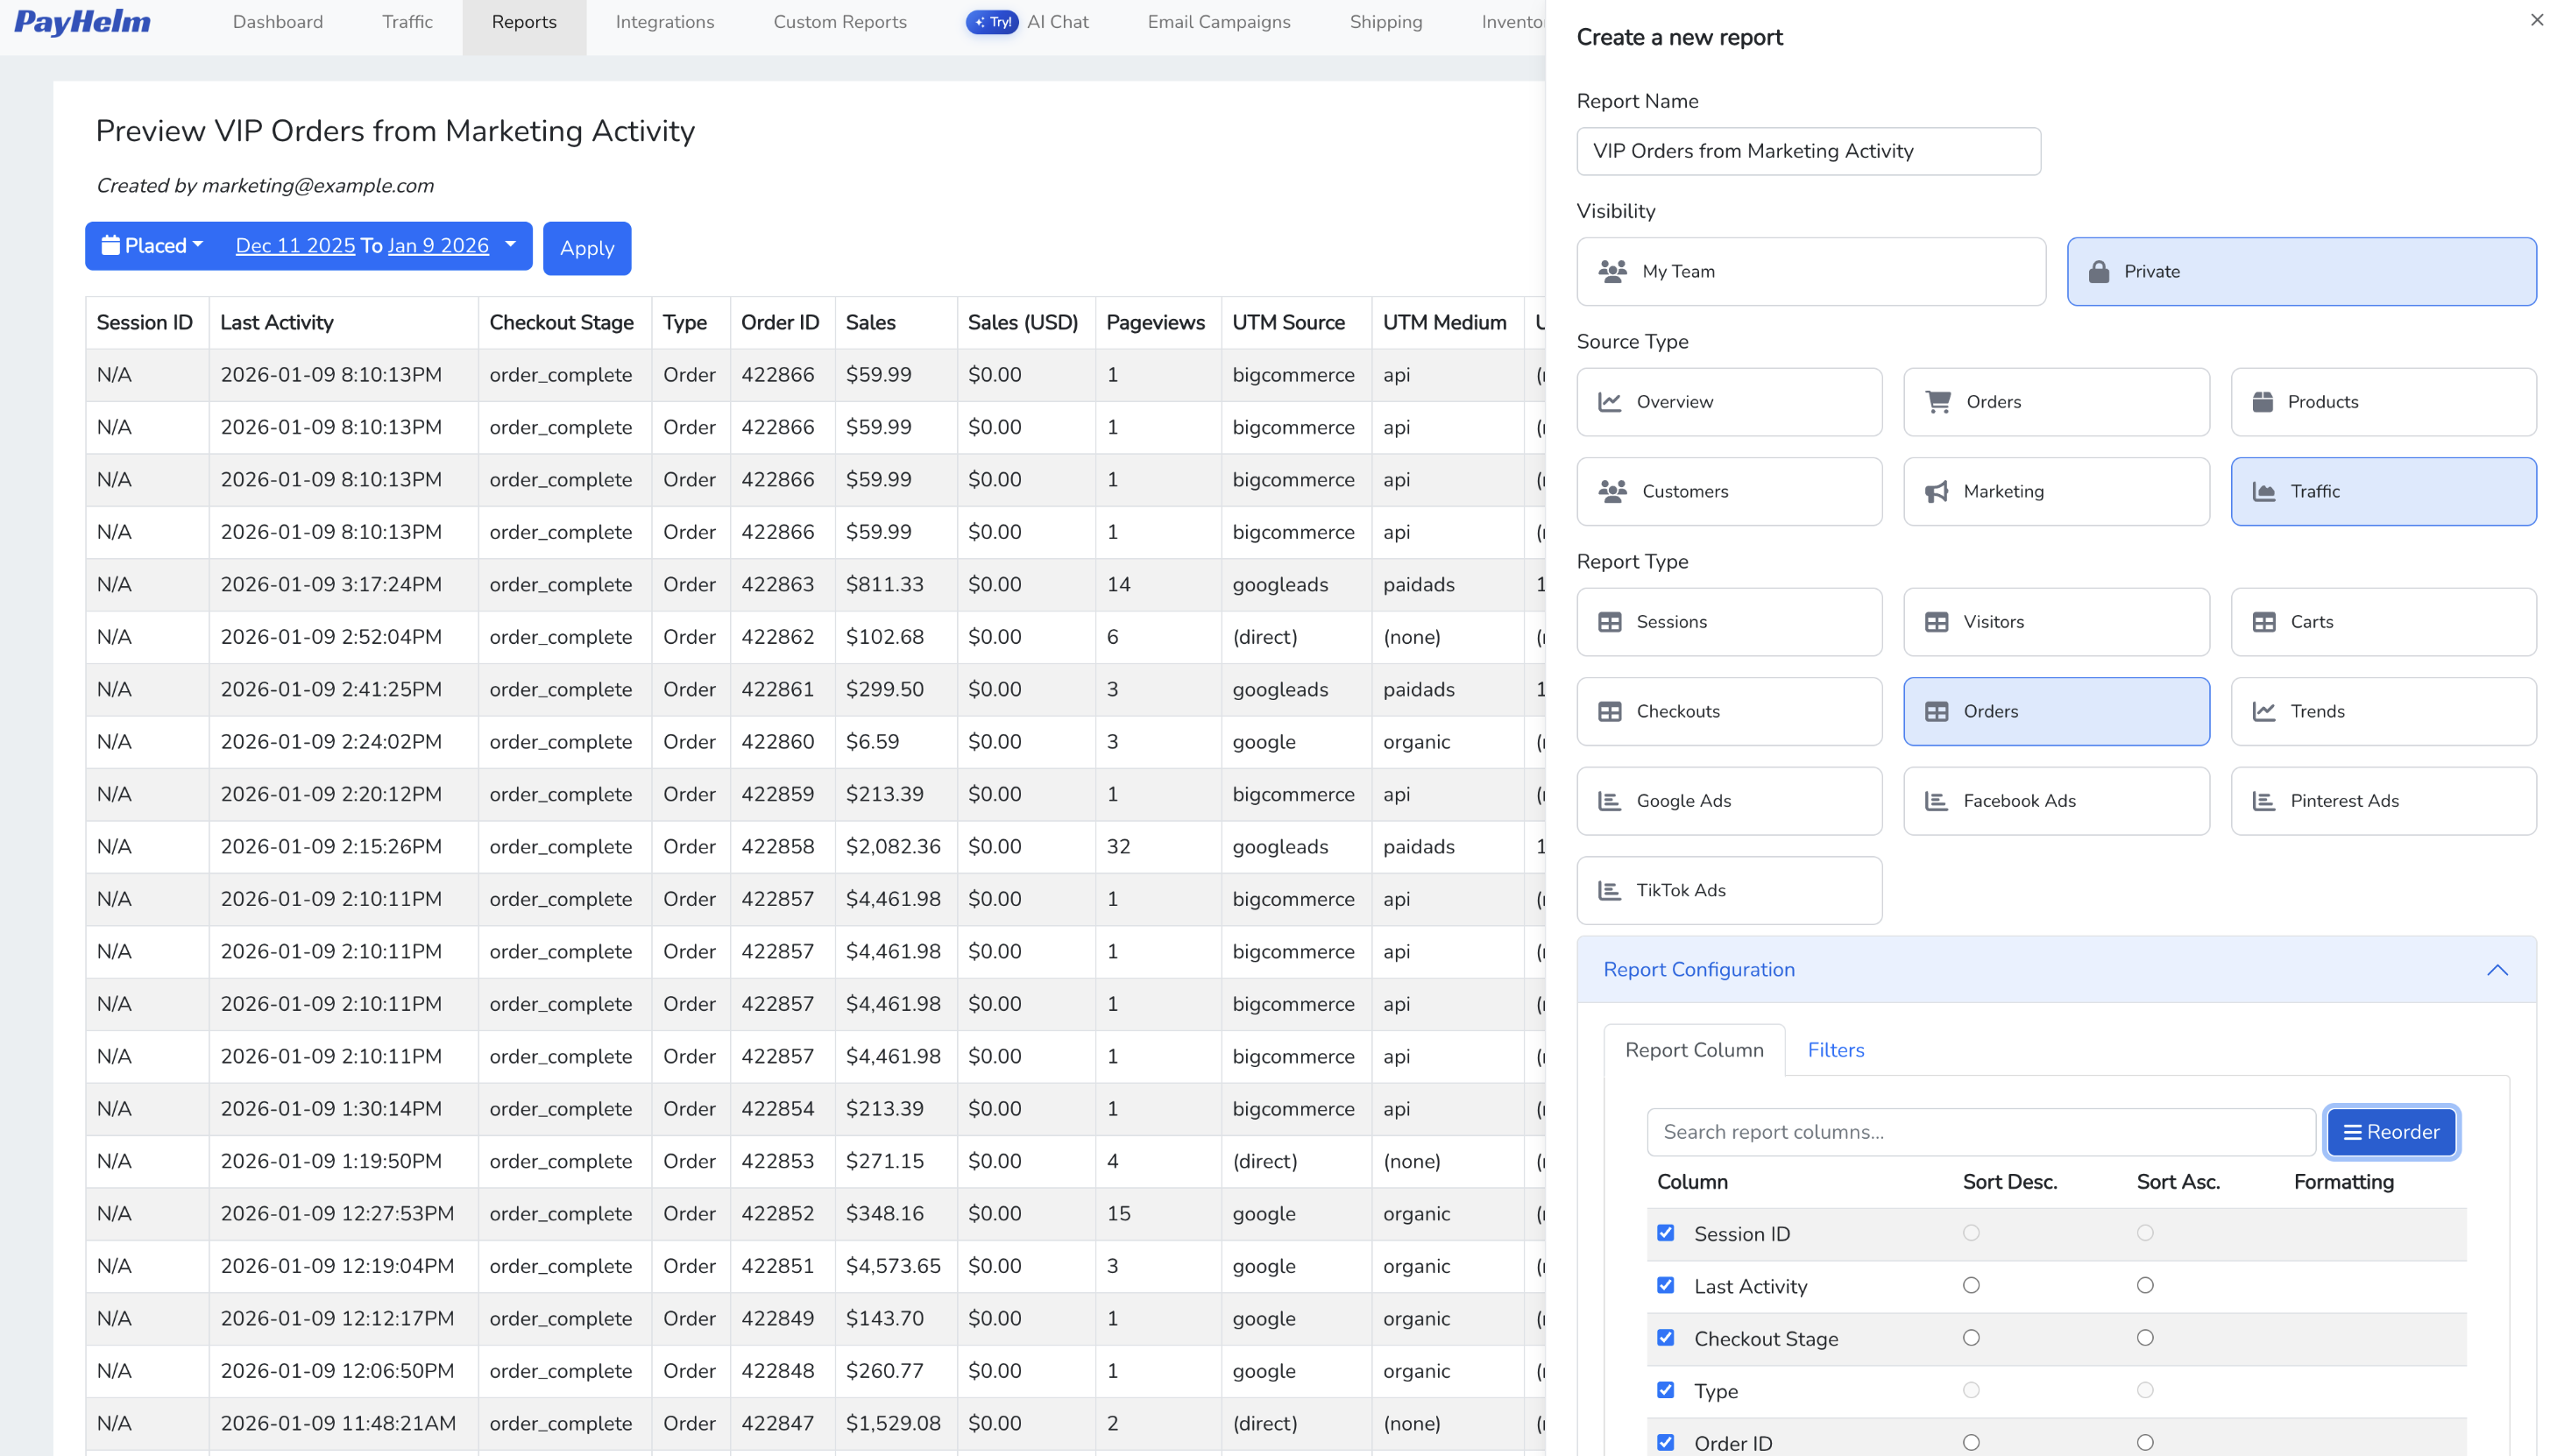
Tips for Traffic Reports
- Use date ranges - Adjust the date picker to analyze specific time periods
- Compare channels - Use UTM Medium segmentation to compare traffic sources
- Track campaigns - Segment by UTM Campaign to see which marketing efforts perform best
- Monitor trends - Use the Trends report type to spot patterns over time
Why Traffic Reports Matter
Traffic reports give you clarity beyond page views—they show you which efforts actually drive results. By connecting sessions, campaigns, and conversions in one place, PayHelm helps you quickly see what's working, what needs attention, and where to invest next. Whether you're optimizing ad spend, refining marketing channels, or spotting trends before they impact revenue, traffic reporting turns visitor data into confident, data-backed decisions—without the guesswork.
Need Help?
If you have questions about creating traffic reports or need assistance with your analytics setup, our team is here to help. Contact our support team or book a demo to get personalized guidance for your business.
Related Articles
Custom Metric Builder
Build any KPI you need using PayHelm's Custom Metric Builder — combine revenue, orders, spend, and more into calculated metrics you can use across every report.
Understanding Dual Commission Reports: Commission vs Sales Tracking
Learn why PayHelm uses two separate commission reports and how each serves a distinct purpose in tracking commission payments versus sales performance for comprehensive sales team management.
Calculate Average Inventory Turns and Time on Shelf
Measure how quickly your inventory sells with inventory turnover metrics and time on shelf analysis to optimize purchasing and identify slow-moving products.
Automate with PayHelm AI
Let an AI agent handle these tasks for you — automatically, on a schedule.
Find Flows with Weak Open, Click, or Revenue Performance
Find the automated flows underperforming and fix them before they cost you more.
Find Broken Product, Collection, or Checkout Links
Detect broken links on your site before they cost you customers and conversions.
Review Performance Max Search Themes and Asset Gaps
Understand what's actually driving your PMax campaigns and where the gaps are.
From the PayHelm Blog
Insights and guides to help you grow your ecommerce business.
Unleash the Power of Amazon Marketplace Analytics with PayHelm
Master Amazon marketplace analytics with PayHelm's comprehensive integration. Learn performance tracking, multi-channel comparison, and competitive analysis strategies.
Smile, You've Got Big Data: Why You Need Business Intelligence
When it comes to ecommerce, retail savvy is no longer enough. You also need business intelligence. Learn how BI can transform your raw data into actionable insights.
The AI Analytics Revolution: How Smart Ecommerce Reporting Will 10x Your Growth in 2026
The ecommerce landscape is experiencing a seismic shift. By 2026, artificial intelligence will fundamentally transform how businesses measure, understand, and optimize their performance. Discover how AI-powered analytics predict what will happen tomorrow and automatically optimize for it.